Three ways to spot whether a stock market is 'truly cheap'
The UK stock market has been described as cheap for several years - but it’s not as simple as that.
2nd December 2019 10:23
by Tom Bailey from interactive investor
The UK stock market has been described as cheap for several years - but it’s not as simple as that.

For the past three years, readers of the financial press will have heard countless times that the UK stock market is 'cheap'. Investors fearing the worst outcome from Brexit, as well as the potential of a Labour government coming to power, have turned their backs on UK shares, pushing the market to supposedly attractive valuations for the more contrarian-minded. This is certainly the view of Richard Staveley, a fund manager at Gresham House Strategies. He says:
“Compared to other established markets globally, the UK looks the cheapest on a relative basis.”
But what does it actually mean to say that the UK is cheap? As with individual stocks, there are multiple ways by which to judge the value of a market. We take a look at some of the considerations investors need to take into account when trying to gauge how cheap a market is.
A popular way to gauge the ‘cheapness’ of a market is to look at its price-to-earnings ratio. The PE ratio is the share price of a company divided by the company’s annual earnings per share. This can then be applied to the market as a whole, using average price and earnings values.
The UK’s FTSE 100 currently has a PE ratio of around 15 times, at the time of writing (late October). Is the UK cheap on this basis? Compared to other markets around the world, not particularly. Russia, one of the cheapest in the world, currently has a PE of around 5 times. China’s is 9.8 times, South Korea’s is 12.7 times, and Italy’s is 13.7 times.
Price-to-earnings ratio
Compared against those markets, the UK could appear expensive. But then compared to other markets it could be argued that the UK is cheap in PE terms: Germany is on 18 times, the US 21 times, and India a whopping 27 times.
The first point is that comparing some markets directly does not always make sense. Each market has its own characteristics. Christopher Gannatti, head of research for Europe at WisdomTree, points out:
“If a given market has a lot of earlier stage companies in technology, price-to-sales might be better than price-to-earnings.”
Similarly, it could be argued that India’s worryingly high PE ratio is the result of investors pricing in strong future growth, with the country expected to be the ‘next China’.
Any attempt to gauge cheapness of a market based on PE requires more context. Historical figures can often provide this, and on this front, the PE ratio for the UK is not that out of sync with historical averages. As Job Curtis, manager of City of London (LSE:CTY), says:
“The PE ratio for the UK equity market [the FTSE 350] is in line with the long-term average going back to 1993.”
Yields
Another way to determine the value of a market is to look at the yield. According to Staveley: “The UK market dividend yield of 4.6% [late October] stands out as bargain basement when compared to all asset classes and markets, if it can be sustained.”
As dividend is calculated by dividing the annual dividend by the current share price, a higher yield can indicate two things: low stock prices or a generous dividend policy. It can also indicate both. Compared to other markets around the world, the UK’s yield is highly attractive. That said, the UK has historically been a generous dividend payer, so it makes sense to compare today’s current yield relative to history.
On this measure, the FTSE 100’s current yield of 4.8% is attractive, because over the past 30 years its average dividend yield has been 3.3%, according to John Kingham of research website UK Value Investor.
The FTSE All-Share yield is increasingly enticing
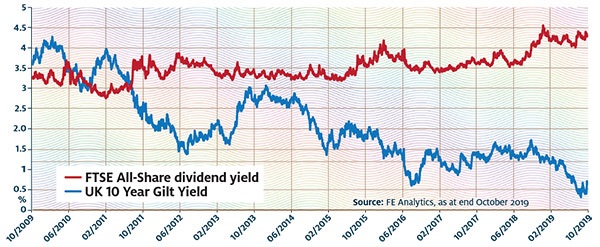
Compared to gilts
This figure can be given even more context by comparing it to the yield on UK 10-year government bonds, a ratio known as the yield spread. William Meadon, portfolio manager of JP Morgan Claverhouse investment trust (LSE:JCH), notes that with the yield on bonds at 0.7% and the UK FTSE All-Share yield on 4.6%, the gap between the two is at its highest since the First World War. “This implies there is a once-in-a-generation value in UK equities when compared to gilts,” he says.
However, Curtis is slightly sceptical. He points out that historically 10-year gilt yields were much higher: above 6% in 1993, 4% in 2003, and around 2% in 2013. Therefore, the current gap is arguably more a reflection of how expensive and excessively valued bonds are, rather than a sign of cheapness for UK shares.
Russ Mould, investment director at AJ Bell goes even further, saying: “You can argue that dividend yield relative to the 10-year gilt is next to useless, because the Bank of England’s quantitative easing and low-interest-rate policy is distorting the gilt market and artificially depressing the gilt yield.”
There is no silver bullet investors can use to determine whether a market is cheap. Each one is different, so figures can be skewed by the specifics of any particular market. Mould says the usefulness of each measure of value "depends to a degree on the stocks and sectors and industries that predominate within the headline index".
Many fund managers opt for a mix. Philip Matthews, co-manager of the Wise Multi-Asset Income fund, says:
“Taking any one measure of value in isolation can be problematic and we would caution against ever looking at a company purely through one particular lens of value.”
No single measure
Meadon agrees a variety of metrics should be used. “A combination of comparisons will provide a clearer picture,” he says, adding that looking across several measures of value, the conclusion is the UK market as a whole is cheap. He adds: “When we use a composite of UK valuation measures (such as PE, yield, price-to-book) and compare it to the equivalent composite for the world index, the discount of the UK equity market is near a 30-year low, suggesting the UK looks undervalued compared to other equity markets.”
Investors need to consider several things when assessing the value of a market. They must determine how the specific characteristics of that market (historical and current) impact the numbers shown by each metric. They will also need to determine how current valuations stack up against historic figures, while keeping in mind potential reasons for divergence that do not suggest value. Any comparison with other asset classes will also need the same consideration.
Mould concludes:
“Valuation is more of an art than a science. If it was easy, investors would be able to buy in when the market was ‘cheap’, and sell when it was ‘expensive’, to ride bull markets and dodge bear ones.”
What can skew the price-to-earnings ratio?
One of the main criticisms aimed at the PE ratio is that a market could be deemed ‘cheap’ because earnings have just reached their peak in the economic cycle and are about to fall. In addition, the PE ratio is open to being skewed due to specific events. Philip Matthews points out that the post-Brexit slide in the pound boosted the reported earnings of UK companies, thereby increasing its PE ratio. This led to a jump in the FTSE 100’s PE in 2016.
As an alternative, some investors prefer the cyclically adjusted PE ratio (Cape), which averages earnings out over a 10-year period. By taking the average for 10 years, the ups and downs of the cycle are evened out.
However, the Cape ratio does have its drawbacks, one being that it can be slow to recognise economic shifts, given that it looks back 10 years. Other critics of Cape point out that the measure has for the past 25 years declared the US market overvalued – yet across this period it has made investors plenty of money.
Full performance can be found on the company or index summary page on the interactive investor website. Simply click on the company's or index name highlighted in the article.
This article was originally published in our sister magazine Money Observer, which ceased publication in August 2020.
These articles are provided for information purposes only. Occasionally, an opinion about whether to buy or sell a specific investment may be provided by third parties. The content is not intended to be a personal recommendation to buy or sell any financial instrument or product, or to adopt any investment strategy as it is not provided based on an assessment of your investing knowledge and experience, your financial situation or your investment objectives. The value of your investments, and the income derived from them, may go down as well as up. You may not get back all the money that you invest. The investments referred to in this article may not be suitable for all investors, and if in doubt, an investor should seek advice from a qualified investment adviser.
Full performance can be found on the company or index summary page on the interactive investor website. Simply click on the company's or index name highlighted in the article.