Topping up trusts in a ‘cheap’ region that’s out of favour
27th May 2022 15:00
Kepler analysts think shares in this country are cheap and consider whether investors should be adding to their exposure.

This content is provided by Kepler Trust Intelligence, an investment trust focused website for private and professional investors. Kepler Trust Intelligence is a third-party supplier and not part of interactive investor. It is provided for information only and does not constitute a personal recommendation.
Material produced by Kepler Trust Intelligence should be considered a marketing communication, and is not independent research.
At times of high uncertainty, such as that which we now face, it is natural for investors to retrench from taking risk. However, for those investors who can stomach it, it has been proven time and again that capital should be deployed when investor confidence is low. While we don’t want to try to call the bottom, we highlight Chinese equities as a market where there could be attractive opportunities emerging after a year of underperformance. We take a look at what has driven the underperformance and argue that valuations have become attractive. We also argue that investors have traditionally under-allocated to China and that long-term drivers of secular growth warrant a larger allocation to China.
What has caused the crash?
Different countries have dealt with Covid-19 in different ways, but China’s strategy seems to be in stark contrast to other major economies. It seems we are at the tail end of the pandemic in Europe and the US and are learning to live with the virus, but China is still adopting a zero Covid-19 strategy. This means that any regional breakouts are being dealt with through stringent lockdown measures, as has recently happened in major cities across China. This brings an inevitable hit to an economy that has already been battered by supply chain and manufacturing disruptions.
At the start of the year, the Chinese government set a 2022 GDP growth target of 5.5%, but there seems to be little faith in this being achieved given the localised lockdowns. The People’s Bank of China cut rates by 10 basis points at the start of the year and cut bank reserve ratio requirements by 25bp in April. Credit growth is picking up but at a slower pace than anticipated and unlikely to be as effective as the 2020 cuts. Once again, investor confidence has dipped, and the Chinese equity market has moved another leg lower since the start of the year. The MSCI China All-Share index is down year to date (to 09/05/2022) by 16.6%, while the MSCI ACWI was down by just 8.9% (see chart below). We believe investor confidence remains fragile after a poor market performance in the second half of last year when troubles in the real estate sector added to concerns of a slower recovery path.
YEAR-TO-DATE PERFORMANCE CHART
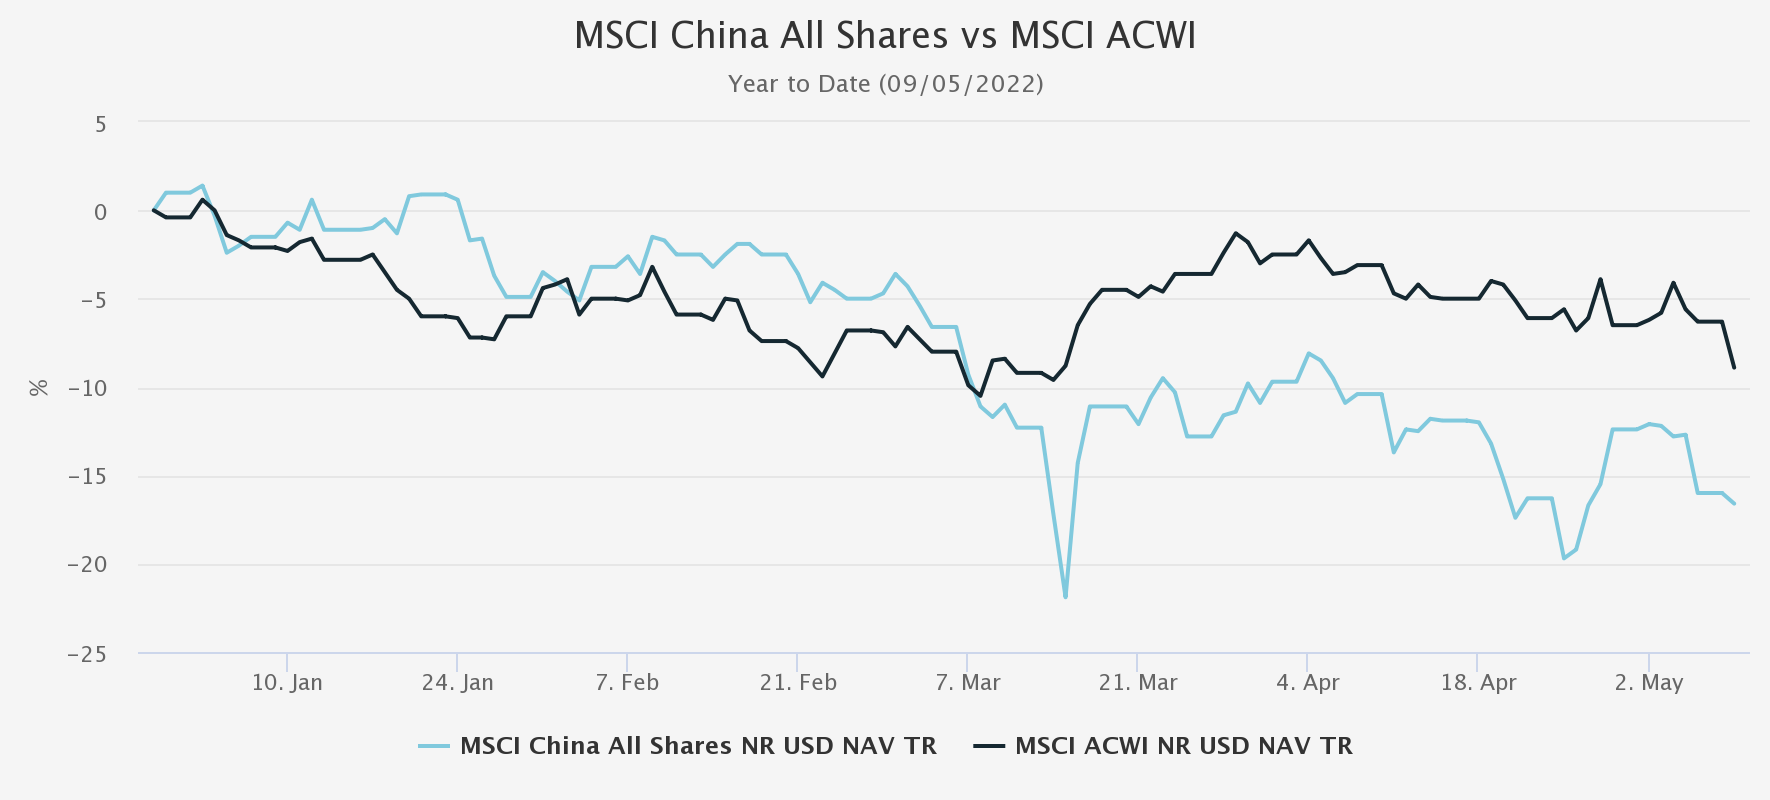
Source: Morningstar. Past performance is not a reliable indicator of future results.
Looking at the Bloomberg current year P/E estimates for the Shanghai Composite Index, it now trades at 8.9x. Over the last 10 years, the peak was 20.9x in 2015 with an average of 11.9x. The current z-score is -1.28, meaning the P/E ratio is 1.3 standard deviations below its five-year mean.
CONSENSUS BLOOMBERG FORWARD P/E ESTIMATES
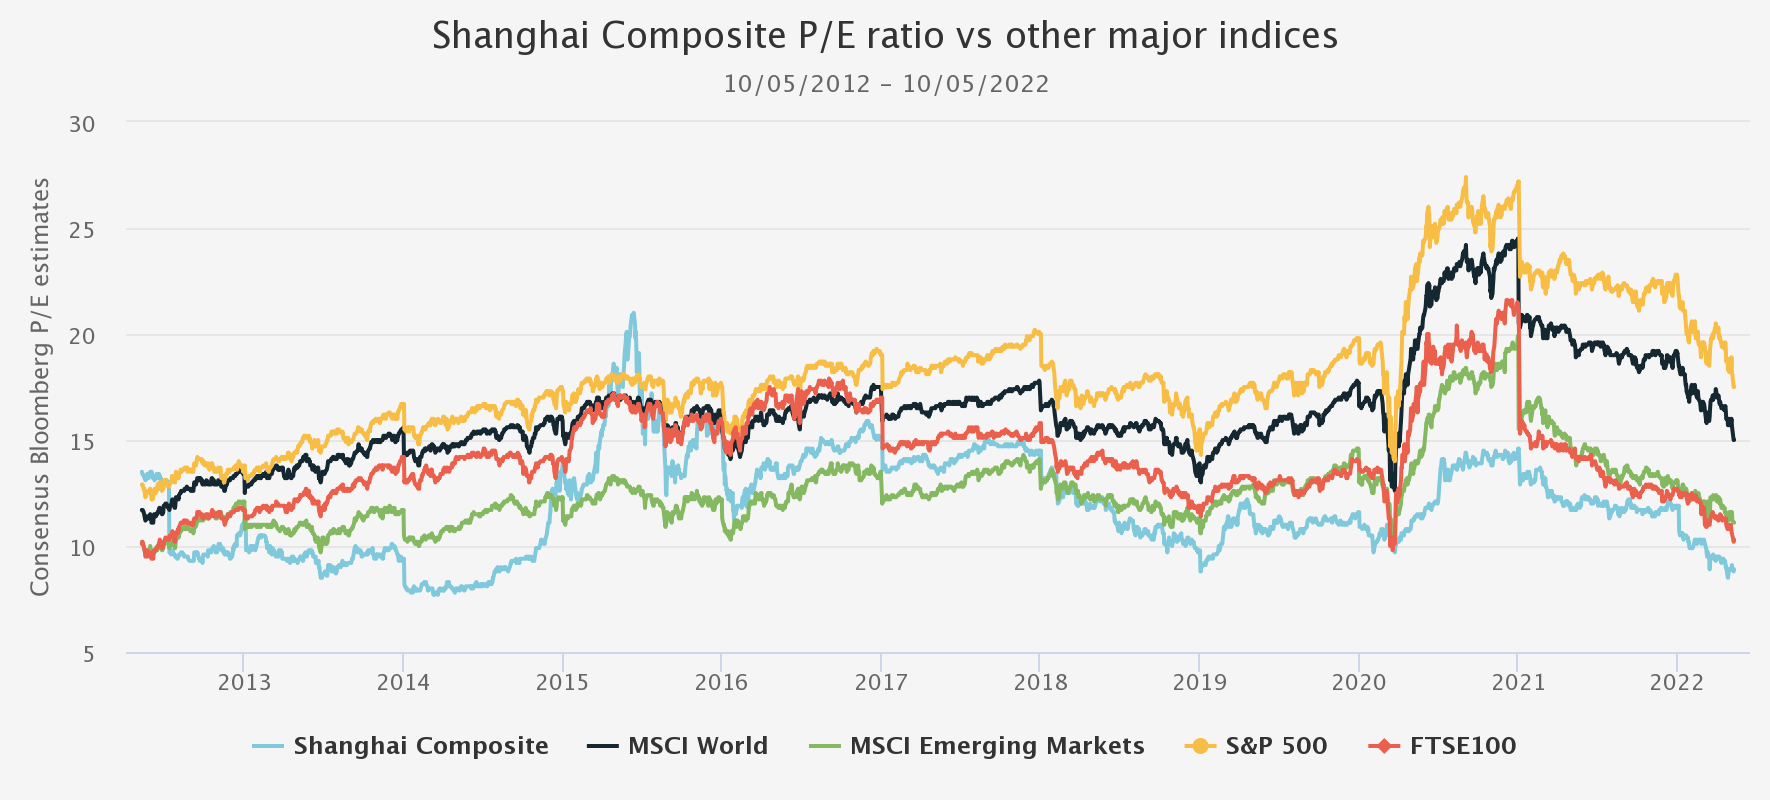
Source: Bloomberg. Past performance is not a reliable indicator of future results.
One thing clear from this chart is that China has historically traded on average at lower price-earnings multiples than the likes of the MSCI World and significantly below that of the S&P 500, which with hindsight will have been justified by the S&P’s outperformance. Chinese stocks have shown intermittent periods of outperformance over the last decade but have underperformed at the index level. This is due to several factors, including policy to curb risk in the shadow banking system, deteriorating US-China trade relations, a strengthening dollar and a moderation of China’s economic growth rate even before the pandemic (see chart below).
CHINA GDP GROWTH RATE
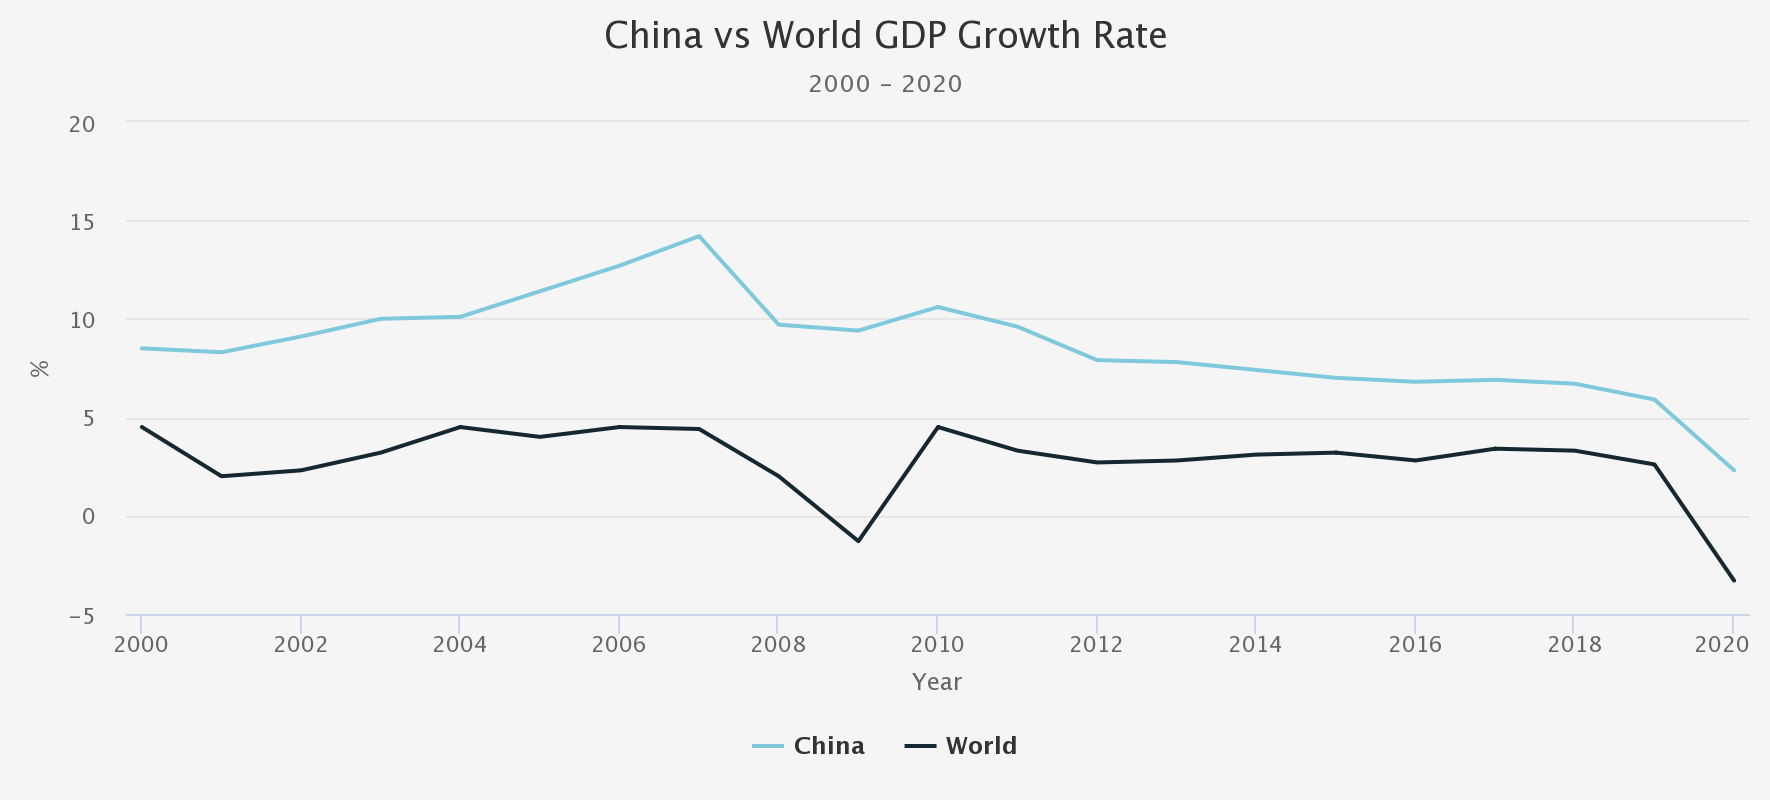
Source: World Bank. Past performance is not a reliable indicator of future results.
What is the immediate outlook?
Chinese stocks have certainly underperformed in the short term compared to global markets, partly due to the pandemic and localised lockdowns. However, one might expect some support to come from the eventual full reopening of the country with demand to recover and supply chain bottlenecks to fade. At a time when other major economic regions are raising interest rates to fight inflation, Chinese policymakers have been adding stimuli this will take time to feed through to the system as a stimulus can only really be effective once the country fully reopens.
With interest rates rising in developed economies, there is great uncertainty about how this will impact the overall economy, especially as a whole generation of consumers and investors have only experienced ultra-low interest rates and low inflation. With certain markets around the world falling into bear market territory, it is worth noting that the Chinese equity market has offered diversification in the past. The table below shows the ten year and two-year correlation coefficients of monthly returns between the MSCI China All Share, FTSE All-Share and MSCI ACWI indices. Over the last ten years, the MSCI China All-Share Index shared a correlation of 0.50 and 0.59 with the FTSE All-Share and MSCI ACWI, respectively, while between the FTSE All-Share and MSCI ACWI, it was much higher at 0.90. Over the last two years, the MSCI China All Share’s correlation with the FTSE All-Share and MSCI ACWI weakened to 0.35 and 0.47, respectively, while that between the FTSE All-Share and MSCI ACWI remained strong at 0.86.
MONTHLY RETURNS CORRELATION MATRIX
| TEN YEARS TO 30/04/2022 | MSCI CHINA ALL SHARES | FTSE ALL SHARE | MSCI ACWI |
| MSCI China All Shares | 1.00 | 0.50 | 0.59 |
| FTSE All-Share | 0.50 | 1.00 | 0.90 |
| MSCI ACWI | 0.59 | 0.90 | 1.00 |
| TWO YEARS TO 30/04/2022 | MSCI CHINA ALL SHARES | FTSE ALL-SHARE | MSCI ACWI |
| MSCI China All Shares | 1.00 | 0.35 | 0.47 |
| FTSE All-Share | 0.35 | 1.00 | 0.86 |
| MSCI ACWI | 0.47 | 0.86 | 1.00 |
Source: Morningstar. Past performance is not a reliable indicator of future results
The pandemic is likely to explain the lower correlation over the last two years, as Chinese markets followed a very different course from the rest of the world. However, there is an argument that going forward, a disconnect between Chinese stocks and other world markets could become more normal. Chinese policymakers are aiming for greater self-sufficiency. By raising standards of living, its economic balance could shift towards internal demand and consumption and be less reliant on overseas exports. Geopolitics could also see China becoming more isolated from the global system. It can therefore be argued that a UK based investor would expect to see more diversification benefits by investing in Chinese companies than a basket of other global companies in the future, although whether this will be helpful in the short term is another question.
What is the long-term outlook?
We believe there are key long-term secular drivers in place that warrant a reasonable exposure to Chinese equities, many of which focus on the next phase of China’s economic development toward a modern economy. Key to this is that as an economy grows, so does disposable income, and so its population, in turn, will want to consume goods and services as we do in the West. As well as physical goods and leisure and entertainment, spending on healthcare and financial services and products such as wealth management and insurance are set to see a long-term uptrend in spending. As an indicator of where China stands in its development stage and how much potential there still is, China had a GDP per head of $10,435 in 2020, while Spain as an example, had a GDP per head of $27,056 (according to The World Bank). This decades-long transition to a consumer-led economy is supported by government policies, which are channelling capital for further investment.
Another key driver is the modernisation of industry. China’s manufacturing processes are becoming more sophisticated and automated, including the increased use of AI and robotics and creating opportunities for companies building the hardware and software for this upgrade.
China will play a big part in the global effort in transitioning toward a greener economy. China’s own transition has a long way to go as it struggles to wean off fossil fuels, but in some ways, it is ahead of other nations. As an example, electric vehicle penetration tripled in China over the past year to 15%, with further sturdy growth expected in the coming years. It is already the leading manufacturer of solar panels and battery technology for the electrification of transport, which is still in the initial stages of adoption around the world. The country may not have a good record in certain aspects such as democracy, individual freedoms and environmental discharge, but it could be seen by investors as an ESG improver on its potential green credentials going forward.
Are investors under-allocated to China?
China is the second-largest economy in the world and home to the second-largest stock market. So, for many investors, a portfolio without an allocation here cannot be considered as diversified or balanced given how important China is to the global economy, but more significantly, how much more important it could be in future. Within a few decades, it has gone from a recluse to becoming the world’s most dominant manufacturer and absorber of global commodities. Even if its economic growth trend moderates, we believe that long-term secular trends should still see it become the world’s largest economy with an abundance of investment opportunities for international investors.
The chart table below shows the world’s top ten countries by equity market capitalisation sourced from The World Bank. The data is a little old, but the overall picture will not have changed much since then. China and Hong Kong combined have a market capitalisation roughly half that of the United States and more than Japan, the United Kingdom, Canada, India, and Saudi Arabia put together. China accounts for around 17% of global GDP yet only makes up for 3.5% of the MSCI All Country World Index, which falls far short if China were to be represented by its market capitalisation. This may be because of a combination of foreign investors’ hesitancy towards a fuller allocation and restrictions on foreign investments by China. Going forward, investors may expect to find some of these barriers to come down. China’s 14th Five Year Plan for 2021-25 reiterates the government’s commitment to further opening capital markets to overseas investors.
TOP 10 MARKET CAPITALISATION BY COUNTRY
| COUNTRY | MARKET CAPITALISATION $M | DATE |
| United States | 40,719,661 | 2020 |
| China | 12,214,466 | 2020 |
| Japan | 6,718,220 | 2020 |
| Hong Kong | 6,130,420 | 2020 |
| United Kingdom | 3,570,894 | 2014 |
| Canada | 2,641,455 | 2020 |
| India | 2,595,466 | 2020 |
| Saudi Arabia | 2,429,102 | 2020 |
| France | 2,365,950 | 2018 |
| Germany | 2,284,109 | 2020 |
Source: World Bank.
Furthermore, we believe the majority of portfolios amongst typical UK and Western investors are unlikely to have allocations to China that are representative of China’s market capitalisation. There is an argument that Western investors have not fully embraced the Chinese investment opportunities, and there are many valid reasons for this. China hasn’t itself been very open to foreign investors, and geopolitics, knowledge gaps, volatile markets, and fear of being on the wrong side of a communist regime have kept foreign investors in China to relatively small investments. Crucially, most investors gained exposure to China through emerging market funds, and benchmark indices such as the MSCI Emerging Market have an allocation to China of only about 30%, thereby limiting investors exposure to China. This index also limits the allocation to the vast China onshore A-shares market (to around 5%), adding a further constraint than if one were actively to choose to invest through a specialist China fund or direct investments.
Key risks
Investing in China doesn’t come without its risks, and a quick view of Chinese equity index movements over the last five years will show it as being volatile, as seen in the chart below.
FIVE-YEAR PERFORMANCE CHART
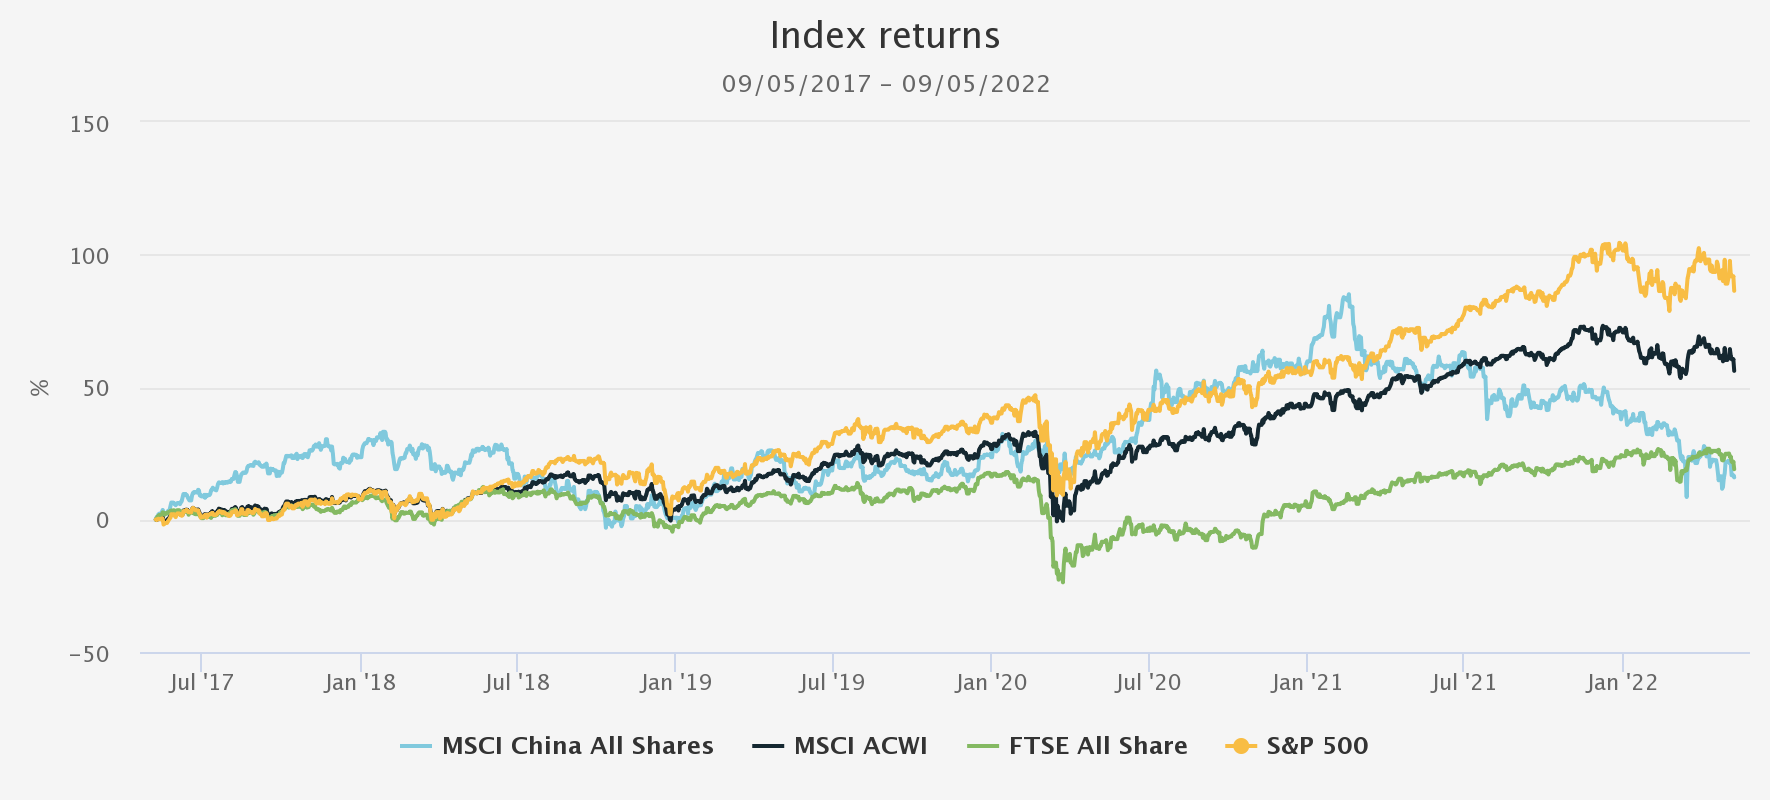
Source: Morningstar. Past performance is not a reliable indicator of future results.
As well as the ongoing lockdown situation, there are political risks. The West and China have been at loggerheads for some time over several issues with sanctions placed on Chinese imports to the US. While China so far has taken a neutral stance on the Ukraine/Russia situation, a deviation here has the potential to flare up into a wider divide between China and the West and a more entrenched trade war. This could derail the opening up of the Chinese market to international investors. Meanwhile, “Onshoring” (where companies bring manufacturing and operations back to their home country) and “deglobalisation” are long term risks that are likely to be more acute for China than in most other countries.
Investment Ideas
The recent market downturn, valuations and long-term growth potential could be attractive to certain investors, and we highlight two investment trusts that are worth considering. Both are closely aligned to the long-term structural transition of rising consumerism, aspiration, health spending, digitalisation and environmental awareness. JPMorgan China Growth & Income (LSE:JCGI) takes a high conviction approach with a focus on high-quality growth companies. It fully utilises its gearing allowance, so any recovery in the market is likely to enhance its performance. It has performed well against its benchmark over the last five years and has an attractive yield as the board seeks to pay out 4% of its year-end NAV as dividends. abrdn China (LSE:ACIC)also takes a high conviction approach. The managers see the current weakness in the market as an opportunity to buy quality companies, and such opportunities are particularly rare amongst the healthcare names. This is a growth-focused strategy, but the team see short term uncertainties and is therefore adopting a balance between value and growth opportunities. The current risk-off sentiment sees it trading at a discount of 10.5%, which could be an attraction for investors expecting a turnaround in sentiment.
Kepler Partners is a third-party supplier and not part of interactive investor. Neither Kepler Partners or interactive investor will be responsible for any losses that may be incurred as a result of a trading idea.
These articles are provided for information purposes only. Occasionally, an opinion about whether to buy or sell a specific investment may be provided by third parties. The content is not intended to be a personal recommendation to buy or sell any financial instrument or product, or to adopt any investment strategy as it is not provided based on an assessment of your investing knowledge and experience, your financial situation or your investment objectives. The value of your investments, and the income derived from them, may go down as well as up. You may not get back all the money that you invest. The investments referred to in this article may not be suitable for all investors, and if in doubt, an investor should seek advice from a qualified investment adviser.
Full performance can be found on the company or index summary page on the interactive investor website. Simply click on the company's or index name highlighted in the article.
Important Information
Kepler Partners is not authorised to make recommendations to Retail Clients. This report is based on factual information only, and is solely for information purposes only and any views contained in it must not be construed as investment or tax advice or a recommendation to buy, sell or take any action in relation to any investment.
This report has been issued by Kepler Partners LLP solely for information purposes only and the views contained in it must not be construed as investment or tax advice or a recommendation to buy, sell or take any action in relation to any investment. If you are unclear about any of the information on this website or its suitability for you, please contact your financial or tax adviser, or an independent financial or tax adviser before making any investment or financial decisions.
The information provided on this website is not intended for distribution to, or use by, any person or entity in any jurisdiction or country where such distribution or use would be contrary to law or regulation or which would subject Kepler Partners LLP to any registration requirement within such jurisdiction or country. Persons who access this information are required to inform themselves and to comply with any such restrictions. In particular, this website is exclusively for non-US Persons. The information in this website is not for distribution to and does not constitute an offer to sell or the solicitation of any offer to buy any securities in the United States of America to or for the benefit of US Persons.
This is a marketing document, should be considered non-independent research and is subject to the rules in COBS 12.3 relating to such research. It has not been prepared in accordance with legal requirements designed to promote the independence of investment research.
No representation or warranty, express or implied, is given by any person as to the accuracy or completeness of the information and no responsibility or liability is accepted for the accuracy or sufficiency of any of the information, for any errors, omissions or misstatements, negligent or otherwise. Any views and opinions, whilst given in good faith, are subject to change without notice.
This is not an official confirmation of terms and is not to be taken as advice to take any action in relation to any investment mentioned herein. Any prices or quotations contained herein are indicative only.
Kepler Partners LLP (including its partners, employees and representatives) or a connected person may have positions in or options on the securities detailed in this report, and may buy, sell or offer to purchase or sell such securities from time to time, but will at all times be subject to restrictions imposed by the firm's internal rules. A copy of the firm's conflict of interest policy is available on request.
Past performance is not necessarily a guide to the future. The value of investments can fall as well as rise and you may get back less than you invested when you decide to sell your investments. It is strongly recommended that Independent financial advice should be taken before entering into any financial transaction.
PLEASE SEE ALSO OUR TERMS AND CONDITIONS
Kepler Partners LLP is a limited liability partnership registered in England and Wales at 9/10 Savile Row, London W1S 3PF with registered number OC334771.
Kepler Partners LLP is authorised and regulated by the Financial Conduct Authority.