What now for Barclays shares after recent sell-off?
Lenders gave back a chunk of their recent gains after the bank sector got caught up in the market slump. Independent analyst Alistair Strang reveals what his charts say happens next.
12th August 2024 07:58
by Alistair Strang from Trends and Targets

Things went a little wrong with Barclays (LSE:BARC) as the share price had enacted sufficient work to promote travel to what we’d then shown as 254p. Instead, the rise fizzled out at 242p.
In our defence, we had demanded the share price close above 235p to make growth inevitable but it didn’t happen. Instead, despite the surge to 242p, the highest the share price closed at was 234.05p, thus giving us a clue we’d been watching the correct trend.
- Invest with ii: Open a Stocks & Shares ISA | ISA Investment Ideas | Transfer a Stocks & Shares ISA
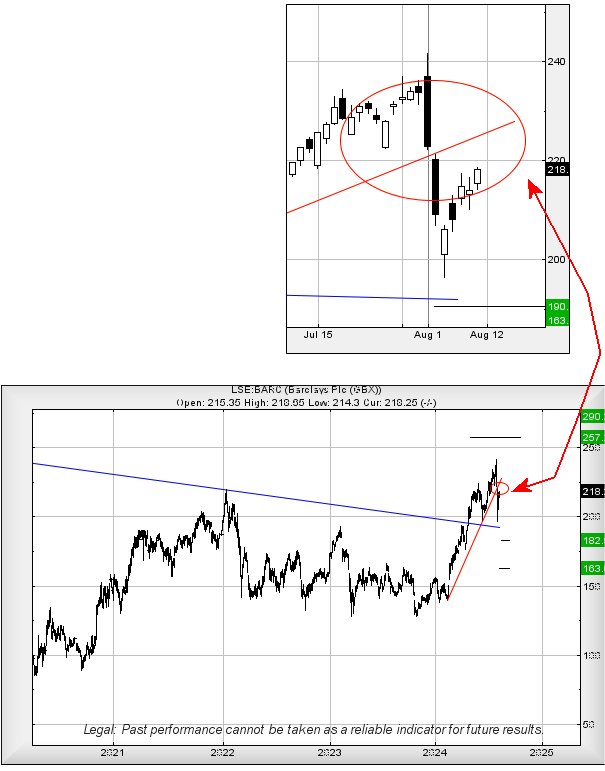
Then things got worse and we’ve circled it on the chart extract below. “They” opted to gap Barclays' share price below the Red uptrend, confirming a suspicion Barclays were not due their day in the sun. Quite the converse appears possible as it’s always a little scary when the market starts forcing a share price down.
Our “Panic” level is set at 195p as closure below such a point shall make reversal potentials serious. Equally, closure above 221.5p shall make recovery potentials serious, and these are two number probably worth printing out an remembering.
Essentially, at present, Barclays has a 26.5p bandwidth which is perhaps worth ignoring, aside from the crucial fact the share price is moving above a Blue downtrend which dates back to 2015.
In theory, this should impart some strength to the price, especially as it doesn’t need to try very hard to close above our 221.5p trigger level. Such a movement now looks capable of triggering recovery to an initial 257p with our secondary, if beaten, at an eventual 290p and a need for us to run and revue our tea leaves.
Alternately, closure below 195p shall be viewed as a bad thing, capable of triggering reversals to an initial 182p with secondary, if broken, a longer term visually unlikely 163p.

Source: Trends and Targets. Past performance is not a guide to future performance.
Alistair Strang has led high-profile and "top secret" software projects since the late 1970s and won the original John Logie Baird Award for inventors and innovators. After the financial crash, he wanted to know "how it worked" with a view to mimicking existing trading formulas and predicting what was coming next. His results speak for themselves as he continually refines the methodology.
Alistair Strang is a freelance contributor and not a direct employee of Interactive Investor. All correspondence is with Alistair Strang, who for these purposes is deemed a third-party supplier. Buying, selling and investing in shares is not without risk. Market and company movement will affect your performance and you may get back less than you invest. Neither Alistair Strang or Interactive Investor will be responsible for any losses that may be incurred as a result of following a trading idea.
These articles are provided for information purposes only. Occasionally, an opinion about whether to buy or sell a specific investment may be provided by third parties. The content is not intended to be a personal recommendation to buy or sell any financial instrument or product, or to adopt any investment strategy as it is not provided based on an assessment of your investing knowledge and experience, your financial situation or your investment objectives. The value of your investments, and the income derived from them, may go down as well as up. You may not get back all the money that you invest. The investments referred to in this article may not be suitable for all investors, and if in doubt, an investor should seek advice from a qualified investment adviser.
Full performance can be found on the company or index summary page on the interactive investor website. Simply click on the company's or index name highlighted in the article.