What these new charts tell us about bitcoin
29th January 2019 12:04
by Gary McFarlane from interactive investor
Down at a six-week low, our award-winning crypto analyst turns to the charts for guidance on direction.

Bitcoin opened the week with a 3% drop after a period of rangebound trading gave way to another bout of selling. It is currently trading at $3,425, but is showing smaller losses than other top altcoins and crypto assets.
The leading crypto is now threatening to approach a pivotal position if it trends lower to test support at the $3,170 level, which coincides with the 200-day moving average (MA) on the one-week chart (green line in chart 1 below).
Chart 1
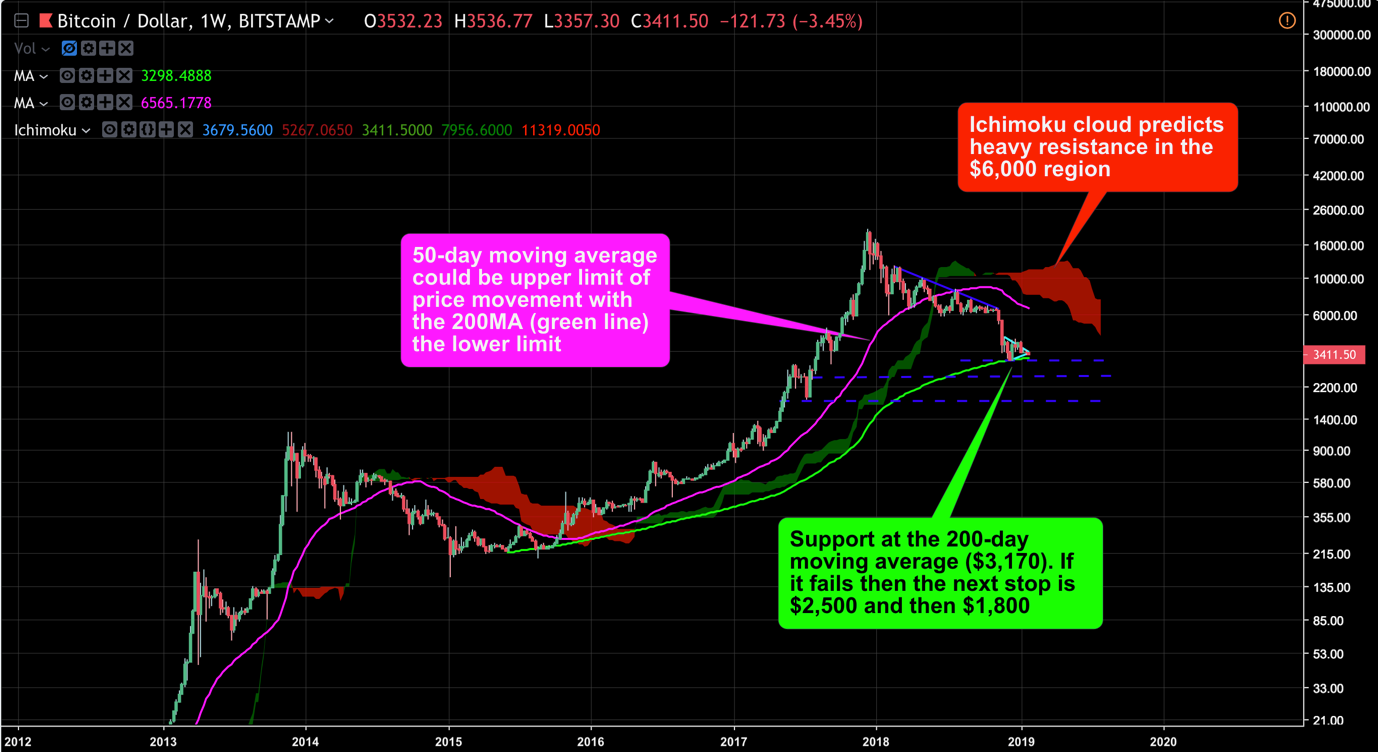
Source: TradingView (*) Past performance is not a guide to future performance
The price fall follows rangebound activity since 14 January, echoing a similar period of calm before the price crashed from $6,300 in November last year. A technical indicator, the Ichimoku cloud, predicts problems at around the $6,000 level – the thicker the cloud (see red on the chart above), the stiffer the resistance.
At the time of writing, bitcoin is trading at the bottom of the recent range but has not weakened further as yet.
The wedge formation seen in chart 2 below formed by the top ($4,420) of the descending triangle (light blue trend line), with the bottom line proceeding from the lows in December last year, handily signalled the timing of the latest decline.
Chart 2
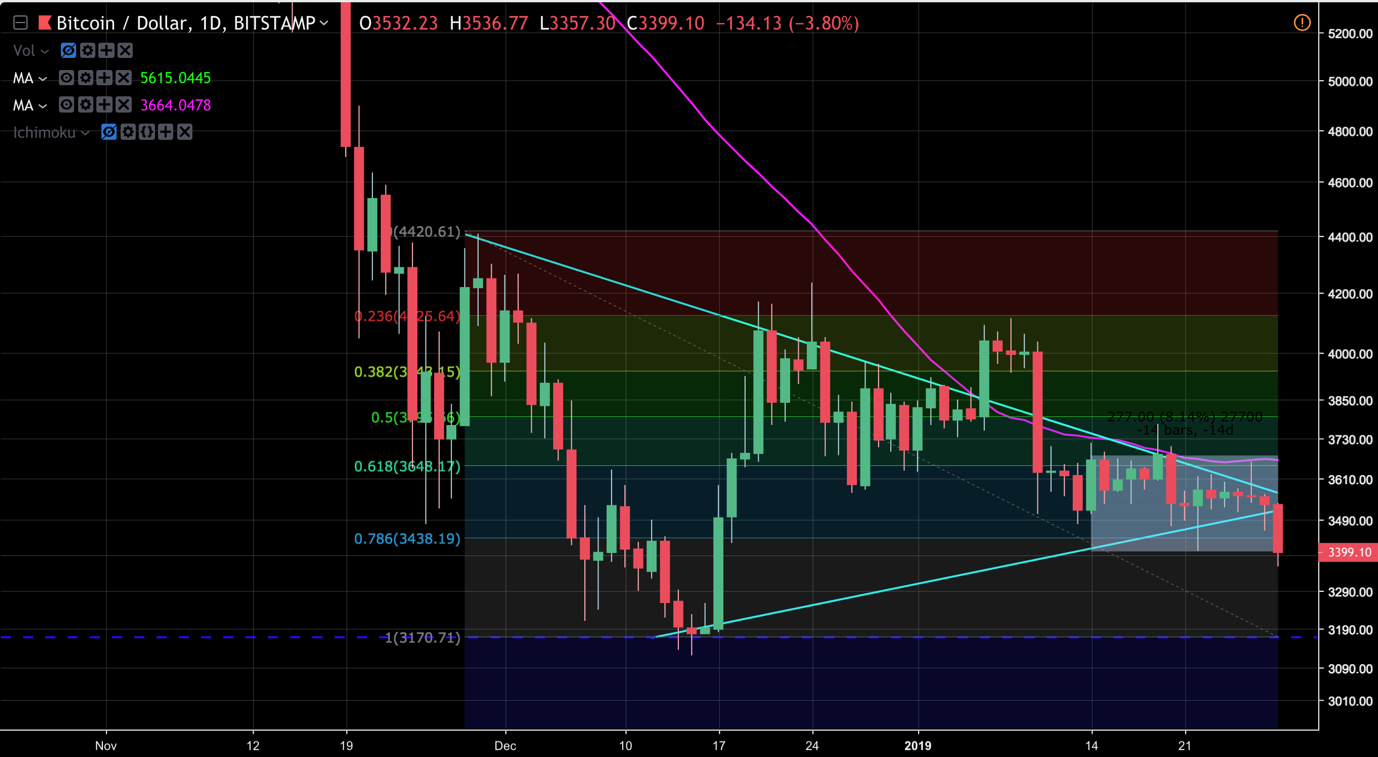
Source: TradingView (*) Past performance is not a guide to future performance
Assuming the bitcoin price holds at the 200MA (green line in chart 1), the region between it and the 50MA (purple line in chart 1) could be the likely extent of price movements for the period ahead.
The triangle formation discerned from February 2018 until November when the price broke decisively lower shows a succession of lower highs as bears became progressively exhausted.
Now, that pattern may be set to repeat itself (see Chart 3), albeit in somewhat compressed form. However, the triangle shown with the light blue line may be prematurely acute and instead the price may rebound off the 200MA at $3,170 , having the effect of extending the triangle with further lower highs, perhaps petering out sometime around May.
Chart 3
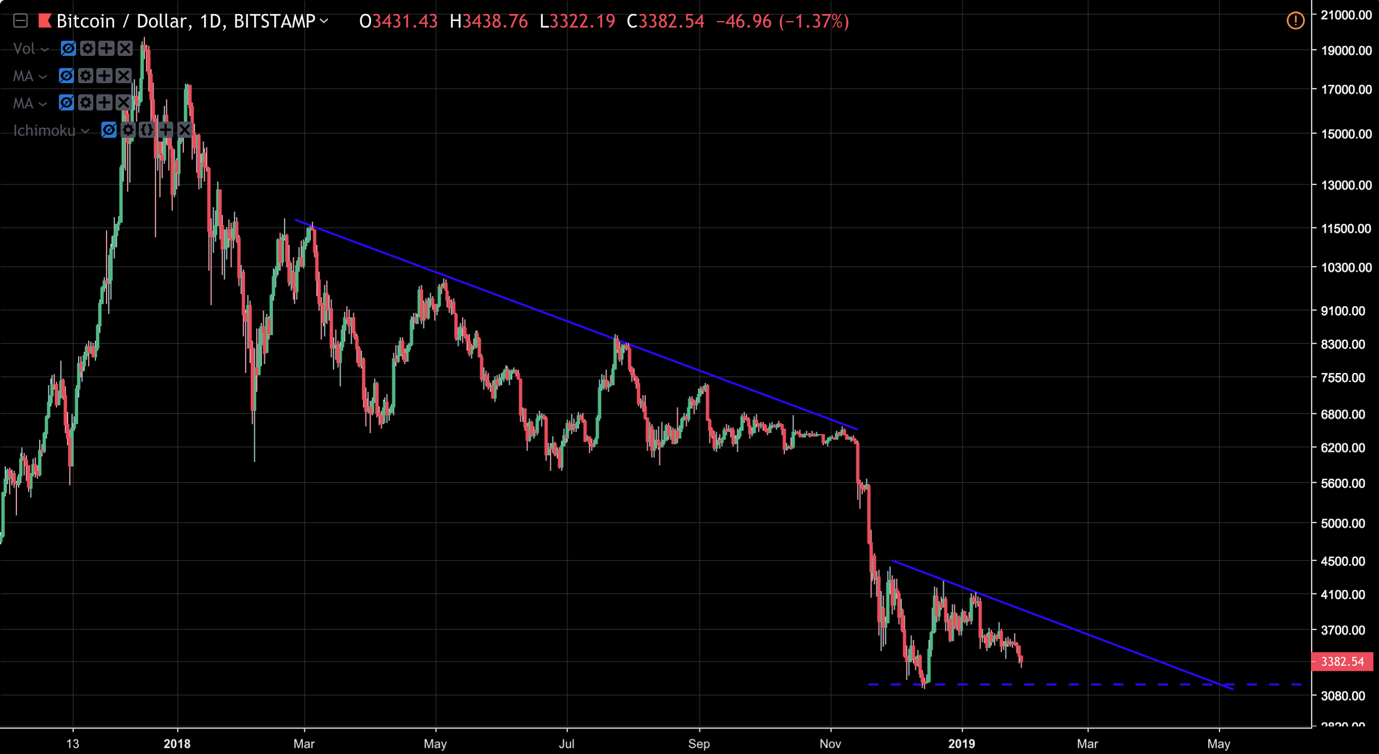
Source: TradingView (*) Past performance is not a guide to future performance
Either way, a decisive capitulation of the bulls is required before the market turns upwards. It is hard to determine whether such an eventuality is imminent, or perhaps the price will move around within the moving average band previously described until year end.
These articles are provided for information purposes only. Occasionally, an opinion about whether to buy or sell a specific investment may be provided by third parties. The content is not intended to be a personal recommendation to buy or sell any financial instrument or product, or to adopt any investment strategy as it is not provided based on an assessment of your investing knowledge and experience, your financial situation or your investment objectives. The value of your investments, and the income derived from them, may go down as well as up. You may not get back all the money that you invest. The investments referred to in this article may not be suitable for all investors, and if in doubt, an investor should seek advice from a qualified investment adviser.
Full performance can be found on the company or index summary page on the interactive investor website. Simply click on the company's or index name highlighted in the article.