Where next for bonds?
12th June 2023 11:49
by Mark Munro from Aberdeen
With central banks now widely believed to be nearing a pause phase following a period of aggressive rate-hiking, we consider what this could mean for bonds.

Key highlights
Global bond markets have endured an unprecedent period of monetary tightening…
…however, with inflation declining, a pause in rate-hiking now appears to be in sight
Monetary pause periods and subsequent rate-cutting phases are usually good for bond returns
Declining inflation and elevated recession risks enhance the case for increased allocation to core government bonds
In corporate bonds, higher quality investment grade should offer more resilience compared with high yield amid
Global bond markets have been contending with the most aggressive monetary tightening in living memory. However, as a result, yields across the board have picked up significantly and valuations now appear historically attractive, with coupons providing sizeable downside cushioning. At the same time, perhaps the most notable positive is that the main drag factor in the last 15 months of rising policy rates now looks close to being paused and even reversed later on.
The great inflation shock and monetary tightening
For context, it’s important to remember that before the Covid-19 shock, the global economy had become accustomed to a sustained period of low inflation. In the US, monthly consumer price inflation (CPI) averaged just 2.1% in the 20 years to end-2020, and just 1.7% in the decade to end-2020. However, supply line disruption following the pandemic was highly inflationary. This was particularly so after the end of lockdowns in 2021, with surging energy prices and fiscal largesse also pushing inflation much higher.
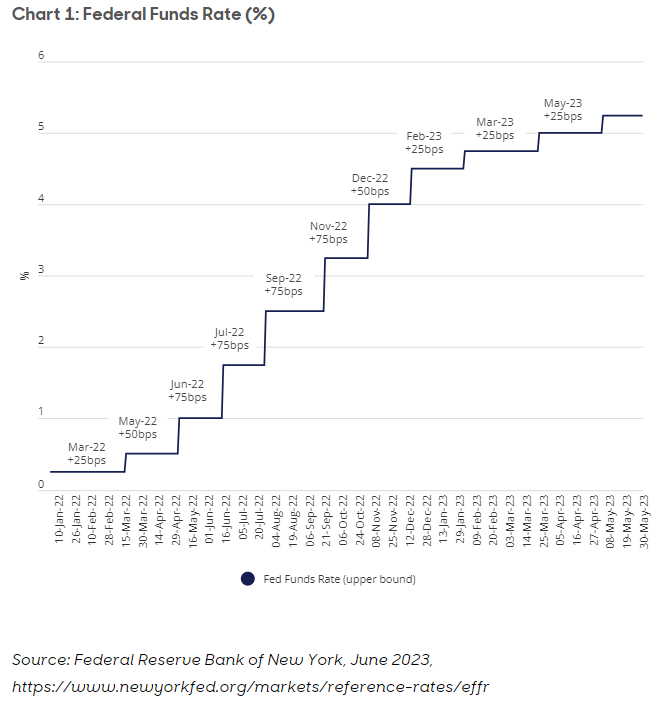
Crucially, both the extent and longevity of higher inflation were consistently underestimated. The US CPI rate hit multi-decade highs and a peak of 9.1% year-on-year (y/y) in June 2022, and 10.6% y/y in the eurozone in October 2022. With central bank forecasts also upended, the eventual result was an unprecedented, compressed period of monetary tightening. As shown below, the Federal Funds Rate (FFR) went from a record-low target range of 0.25-0.50% in March 2022 to 5.0-5.25% by May 2023, a remarkable jump of 500 basis points (bps) in a little over a year.
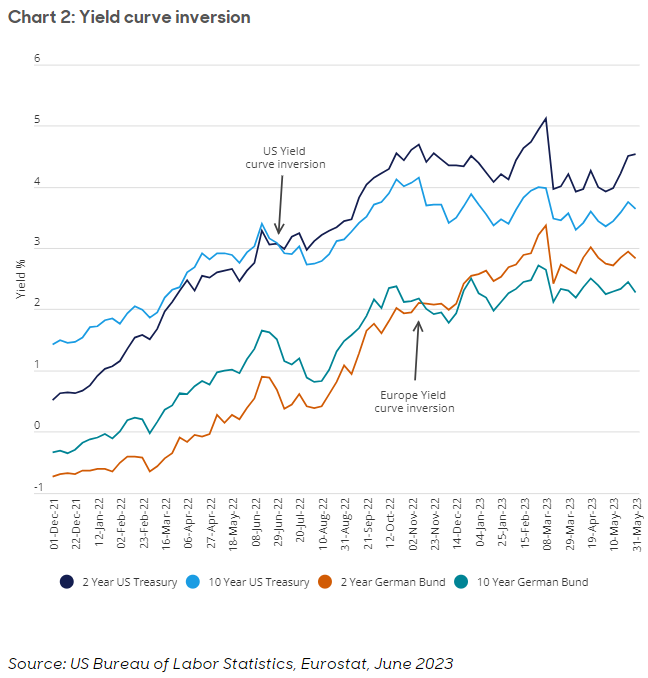
Without doubt, the huge global tightening of the past 15 months, led by the US Federal Reserve (Fed) and European Central Bank (ECB) has been the dominant negative for global bond markets. Indeed, this has coincided with remarkable rises in core government yields. As shown in Chart 2, the US 10-year treasury yield has surged from below 1.5% in December 2021 to around 3.7% as of early June 2023, having gone as high as 4.3% in October 2022. At the same time, as also shown in Chart 2, a two-year treasury yield of around 4.5% and 10-year yield of around 3.7% indicates an ‘inverted’ yield curve.
No less remarkably, the 10-year bund yield went from a negative yield of -0.38% in December 2021 to around 2.3% as of early June 2023. Given the inverse relationship with prices, this kind of sharp upward adjustment in yields was severely punitive not just for core government bonds but also the whole spectrum of global corporate bonds, including investment grade (IG) and high-yield corporates, as well as emerging market debt.
Monetary pause and subsequent easing within sight…
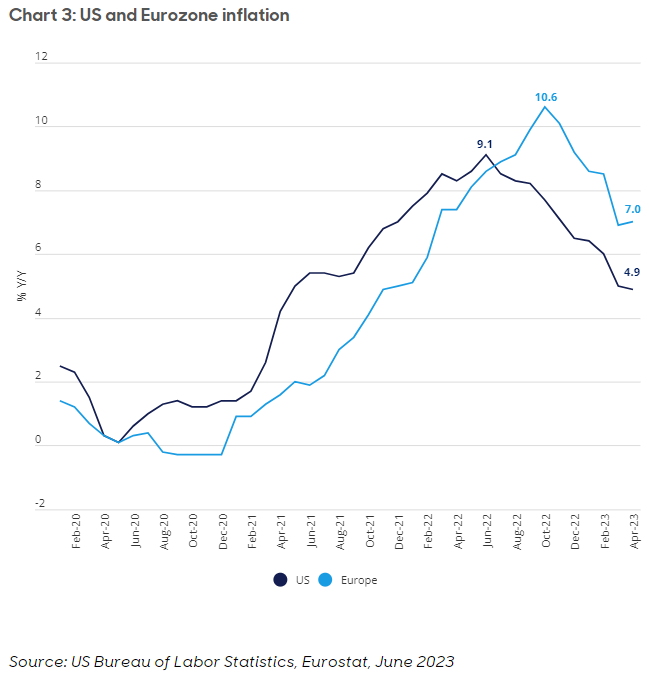
Crucially, however, inflation is now widely seen as having peaked and is declining virtually everywhere. As shown in Chart 3, US CPI peaked at 9.1% y/y in June 2022 and has been on a consistently declining path in recent months, falling below 5% in April 2023. In the eurozone, although on a slightly lagging path, the CPI rate peaked at 10.6% y/y in October 2022 and had fallen to 7.0% y/y by April 2023. In coming months, helped further by base effects and the expected lagged negative demand impact of rate hikes, inflation is expected to continue falling, albeit the pace of decline is uncertain.
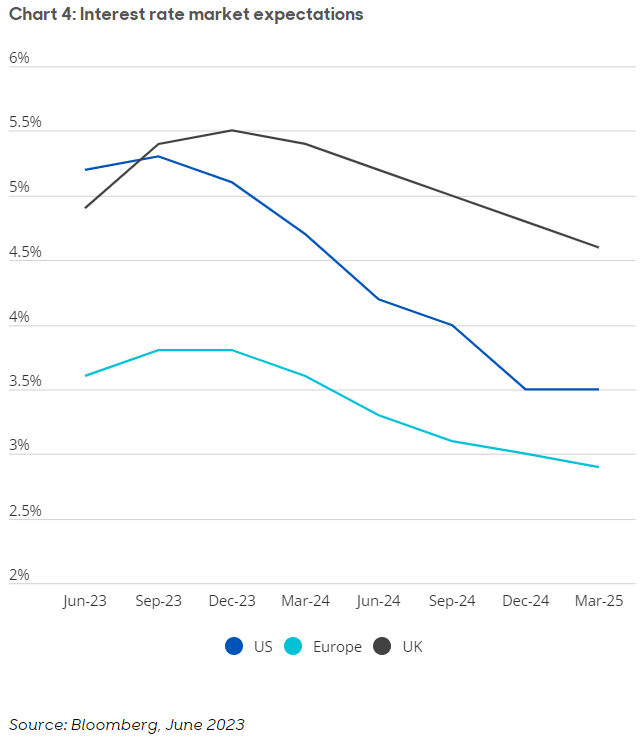
This has led to widespread expectations that we’re close to a potential pause in central bank monetary tightening. Furthermore, this is likely to be followed by monetary easing if economic data begins to sour in line with our expectations. In the case of the Fed, market expectations are suggesting that the current 5.0-5.25% FFR could be the peak for interest rates (see Chart 4). Furthermore, market expectations are that the pause will be followed in quick order – before the end of the year – by the start of a new rate-cutting cycle. A similar scenario is expected in Europe, albeit with slightly later timing.
Performance impact of monetary tightening pauses
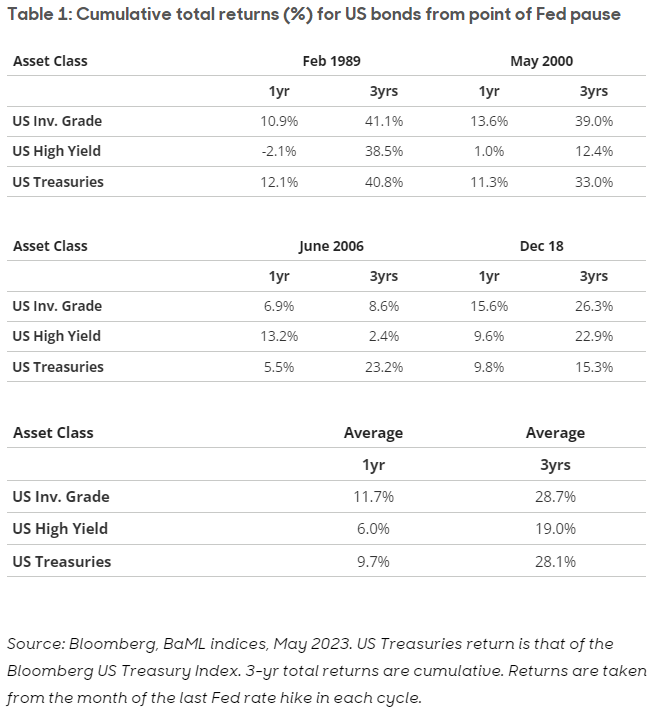
If market expectations regarding policy interest rates are correct, then the previous dominant drag factor for global bond markets won’t just conclude but should also soon begin to reverse. Indeed, current market pricing suggests around 25bps of Fed rate cuts before the end of 2023. As such, the policy rate outlook appears much more favourable for bonds. Indeed, the periods following previous Fed rate-hiking pauses have been positive for bond returns. For example, as shown in Table 1 below, the average 1-year total return for US IG bonds following the last four Fed rate-hiking pauses was 11.7%.
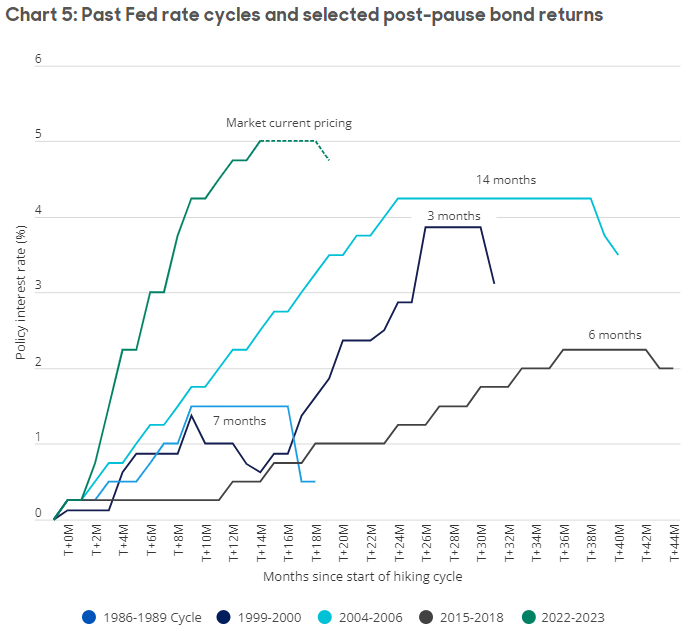
While there is significant variation in timings, Chart 5 above shows the next move in policy rates following rate-hiking pauses is usually lower.
A rate-cutting environment is intrinsically positive for ‘risk-free’ bonds such as treasuries and bunds. In the case of corporate bonds, however, we also need to consider the additional credit spread. When interest rates are being cut, usually this is in a period of weaker economic growth. For corporate bonds, the credit spread is therefore often widening and offsetting the impact of declining risk-free yields.
For riskier bond segments, such as high-yield corporates, credit spreads are generally larger and more sensitive to economic conditions and so (negatively for returns) tend to rise by more than for less risky segments such as IG bonds. As such, as shown table 1, the average 3-year cumulative total return for US IG bonds following the last four Fed rate-hike pause instances was 28.7%. By comparison, for US high-yield bonds, the average 3-year cumulative total return was significantly lower at 19.0%.
Putting everything together – where next for bonds?
The answer depends on numerous factors, including the view on the economic outlook and the specific bond asset class in question. As we’ve shown, a monetary pause environment is typically followed by rate-cutting cycles and is generally positive for bond returns. This is particularly so for ‘risk-free’ core government bonds. For riskier bonds segments, there’s also a likely offsetting negative impact via wider credit spreads.
In our view, the elevated risk of recession in the coming months and sharply declining inflation makes the case for increased allocations to core government bonds. This could also provide some hedging against potentially worse-than-expected economic downturns, as rate-cutting would likely proceed more quickly in such conditions.
On the corporate side, our most favoured segment is IG bonds. This is because, while benefiting from the expected policy rate environment, the higher quality of credits also tends to make them relatively more resilient to weaker economic conditions. This contrasts with high yield corporates, where credit spreads are more sensitive to the economic environment, which usually offsets more of the positive impact of declining rates.
On the duration front, the likely subsequent rate-cutting environment makes the case for increasingly leaning towards higher-duration bonds. This is because higher-duration assets should see relatively more price appreciation following any given rate cut. However, at the same time, we also think there’s a case for selectively increasing exposure to shorter-dated assets (core government and IG bonds). In many cases, inversion means available yields are now significantly above longer-dated yields.
Mark Munro is Investment Director at abrdn
ii is an abrdn business.
abrdn is a global investment company that helps customers plan, save and invest for their future.
These articles are provided for information purposes only. Occasionally, an opinion about whether to buy or sell a specific investment may be provided by third parties. The content is not intended to be a personal recommendation to buy or sell any financial instrument or product, or to adopt any investment strategy as it is not provided based on an assessment of your investing knowledge and experience, your financial situation or your investment objectives. The value of your investments, and the income derived from them, may go down as well as up. You may not get back all the money that you invest. The investments referred to in this article may not be suitable for all investors, and if in doubt, an investor should seek advice from a qualified investment adviser.
Full performance can be found on the company or index summary page on the interactive investor website. Simply click on the company's or index name highlighted in the article.