Why buying ETFs is a no-brainer when investing in US large caps
Briegel Leitao takes a closer look at the iShares Nasdaq 100 ETF and Vanguard S&P 500 ETF.
5th October 2020 12:17
by Briegel Leitao from interactive investor
Morningstar’s Briegel Leitao takes a closer look at the iShares Nasdaq 100 ETF and Vanguard S&P 500 ETF.

While S&P 500s ETFs have lumbered in the wake of the Covid-19 pandemic, those tracking the Nasdaq 100 index have prospered and posted eye-catching returns. Both strategies offer passive cap-weighted exposure to US equities, but they represent very different investment propositions, each with its own strengths. In this article, we contrast and compare these high-profile strategies and two of the most popular ETFs that track them.
Why ETFs?
US equity exposure forms a core part of most investors’ portfolios. Before we dive into the comparison, it is worth revisiting why going passive and buying ETFs is a no-brainer when investing in US large-cap equites. While the benefits of low costs and transparency are welcome, it is the long-term performance of US-equity ETFs that is their key selling point. Our own research has shown that just 1 in 20 actively managed funds have survived and outperformed their passive peers over the trailing 10 years.
- Top 10 most-purchased ETFs in September 2020
- Two alternative ways investors can track the market
- Take control of your retirement planning with our award-winning, low-cost Self-Invested Personal Pension (SIPP)
The Basics
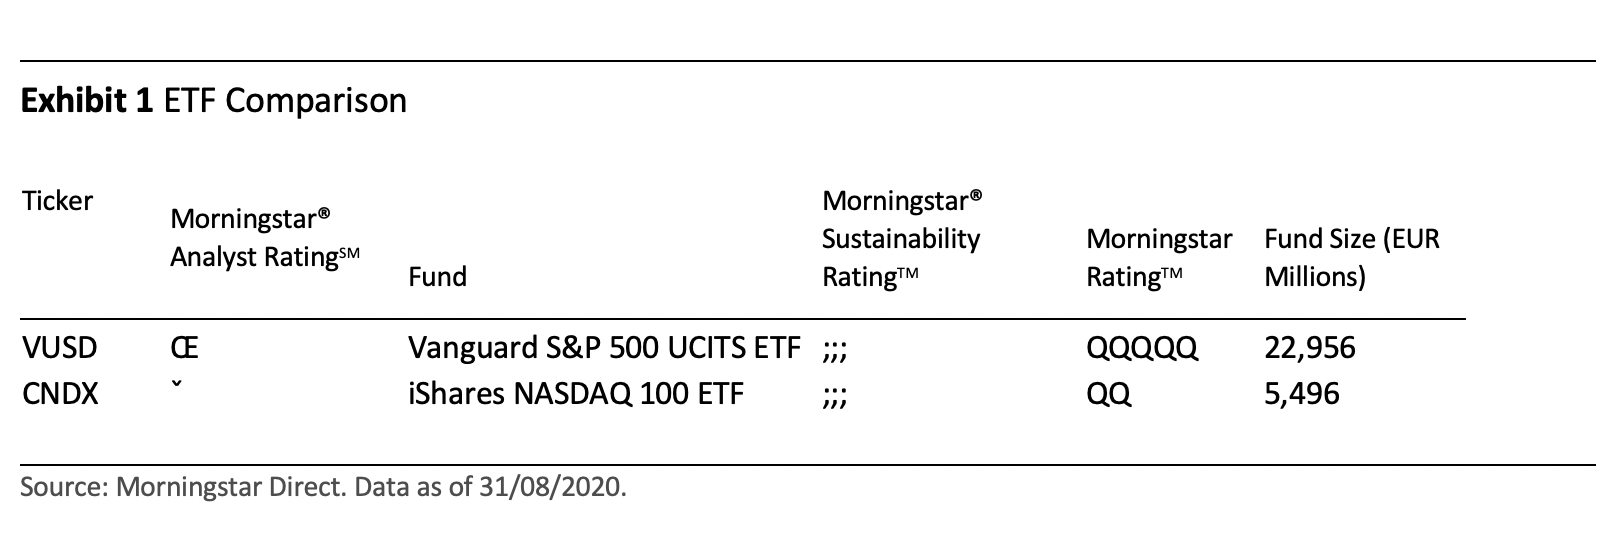
The iShares Nasdaq 100 ETF (LSE:CNX1) selects the largest 100 non-financial companies listed on the Nasdaq stock exchange and weights them by their market capitalisation. The Vanguard S&P 500 ETF (LSE:VUSA) invests in the largest 500 companies listed across all major exchanges in the US (including the Nasdaq), also in proportion to their market size.
On the surface, the two market-cap approaches to investing in US stocks share some similarities. For example, both offer exposure to mega- and large-cap stocks and there is a significant overlap in holdings, with the Vanguard ETF currently investing in 82 of the 100 stocks selected by the iShares ETF. However, a closer inspection of each strategy reveals significant differences, which should be understood before investing.
For a start, the iShares fund has an ongoing charge of 0.33%, considerably higher than the 0.07% charged by the Vanguard ETF. This fee differential can be expected to act as a reliable tailwind for the Vanguard offering, which will boost relative performance over longer investment periods.
Sector differences
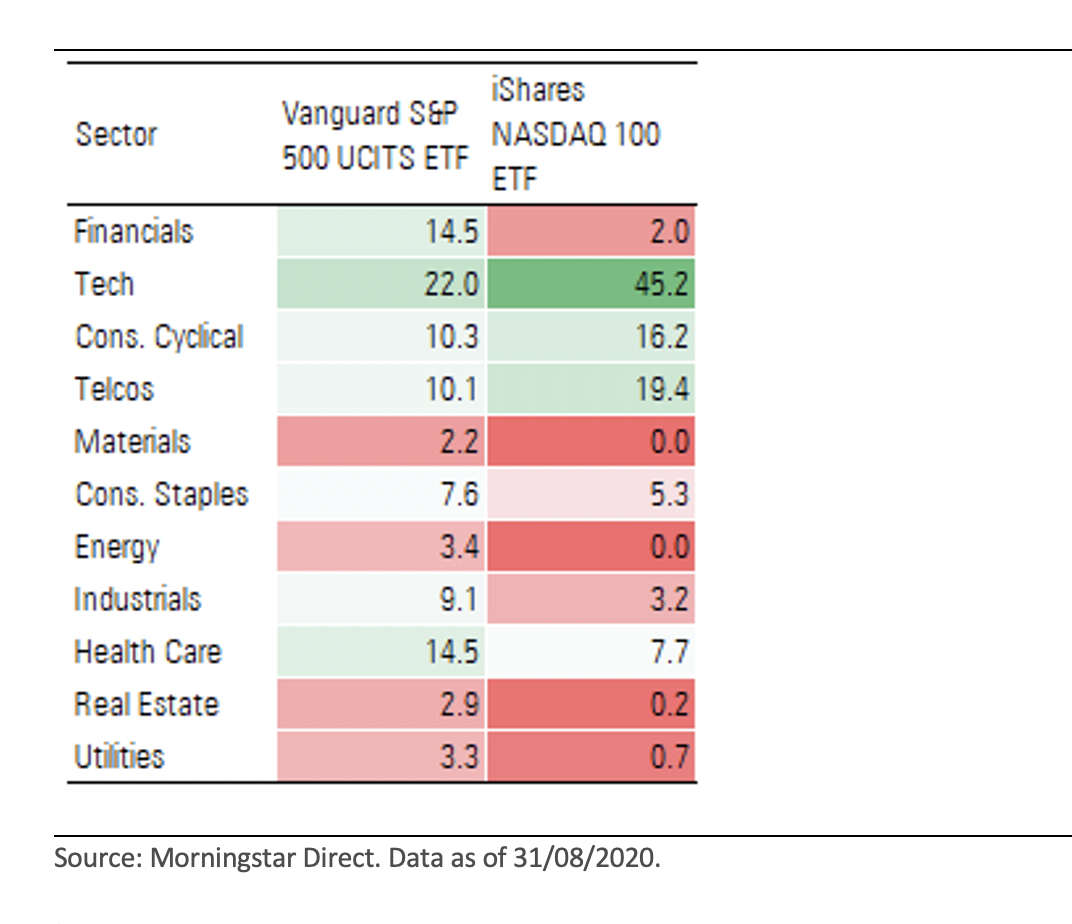
As we can see from Exhibit 2, below, the iShares Nasdaq 100 ETF has allocated almost half its investments to tech companies, with the remainder focused on Consumer Cyclicals and Telecommunication stocks (15% to 20% each). While also favouring tech stocks, the S&P 500 strategy is comparably much more diversified, offering a more balanced representation across sectors.
Exhibit 2 Sector positioning, trailing 12-month average
Performance
By analysing the underlying index, rather than the live track record of the ETFs that track them, we can extend our period of observation.
Exhibit 3 plots 20 years of calendar-year performance for each index, alongside the maximum drawdowns experienced by each over that year. As well as being evidence for the success of buy-and-hold strategies (as end-of-year returns are often nowhere near as bad as peak drawdowns), the data makes two things apparent.
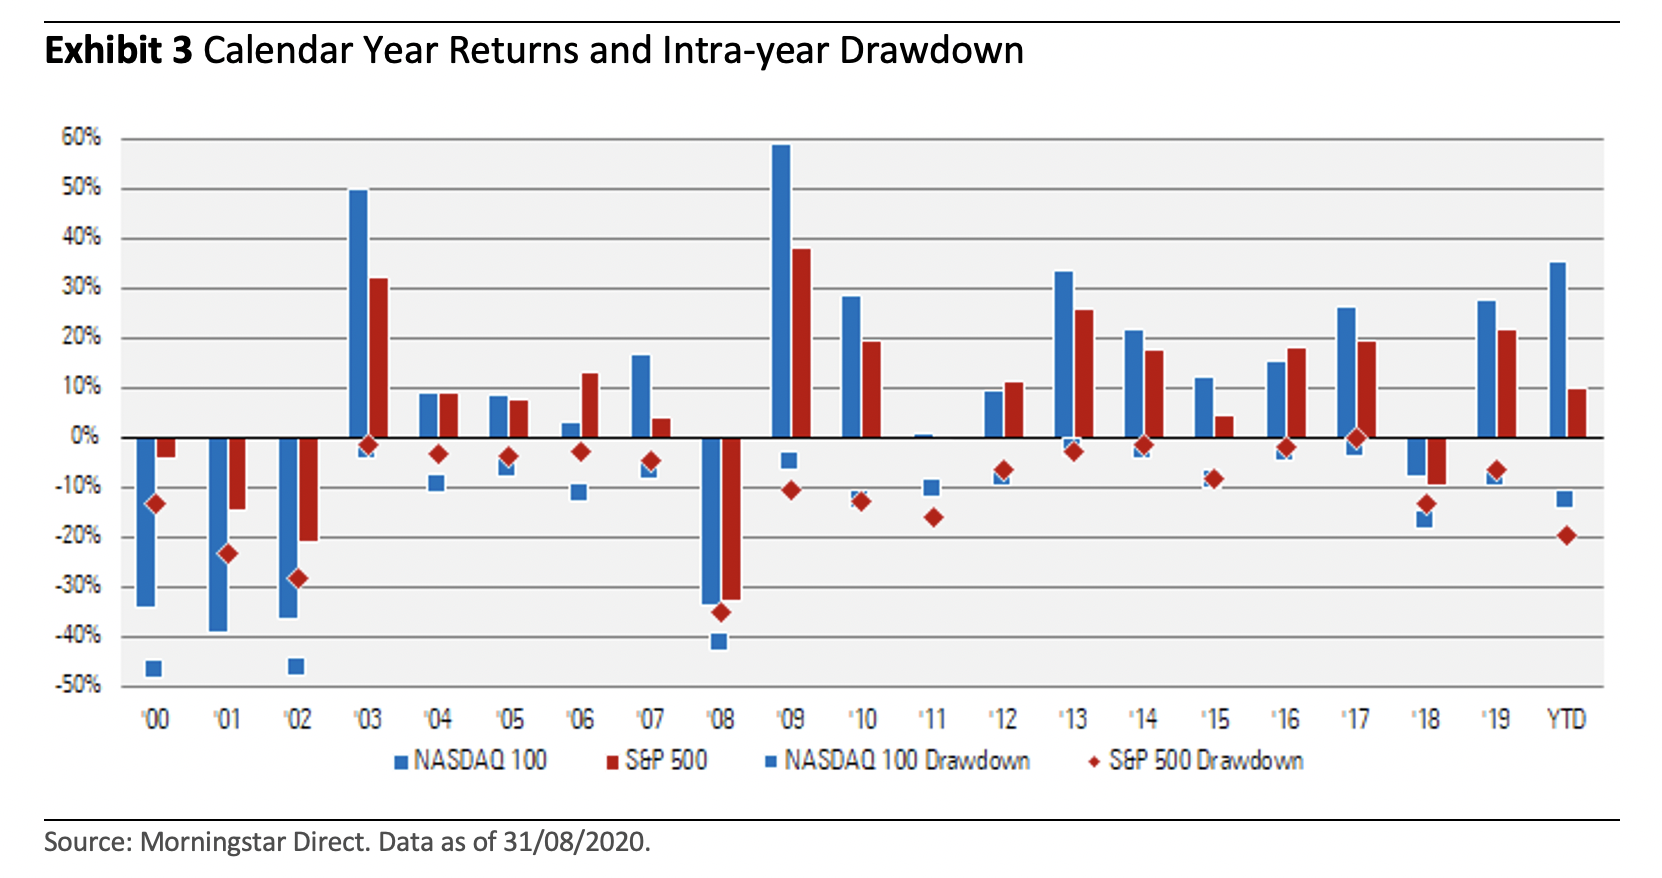
First, during up-markets, or periods of strong recovery, the Nasdaq 100 regularly outpaces the S&P 500, winning 11 out of 15 years of positive performance from both indices. Second, during down-markets, the Nasdaq 100 typically underperforms and offers steeper intra-year drawdowns.
We can see this play out during market rallies such as the Covid-19 recovery where the Nasdaq 100 often leads performance charges, while during periods of market stress such as following the doctom bubble, it suffered more.
The higher volatility of the Nasdaq 100 strategy should not come as a surprise, as it targets a narrower subset of stocks than the S&P 500 and, therefore, benefits less from the risk-dampening effects of diversification.
Investors with lower appetites for short-term volatility spikes may find themselves uncomfortable investing in a Nasdaq 100 strategy, preferring a fund such as the Vanguard S&P 500 ETF as a more diversified, more representative alternative.
Is now a good time to invest?
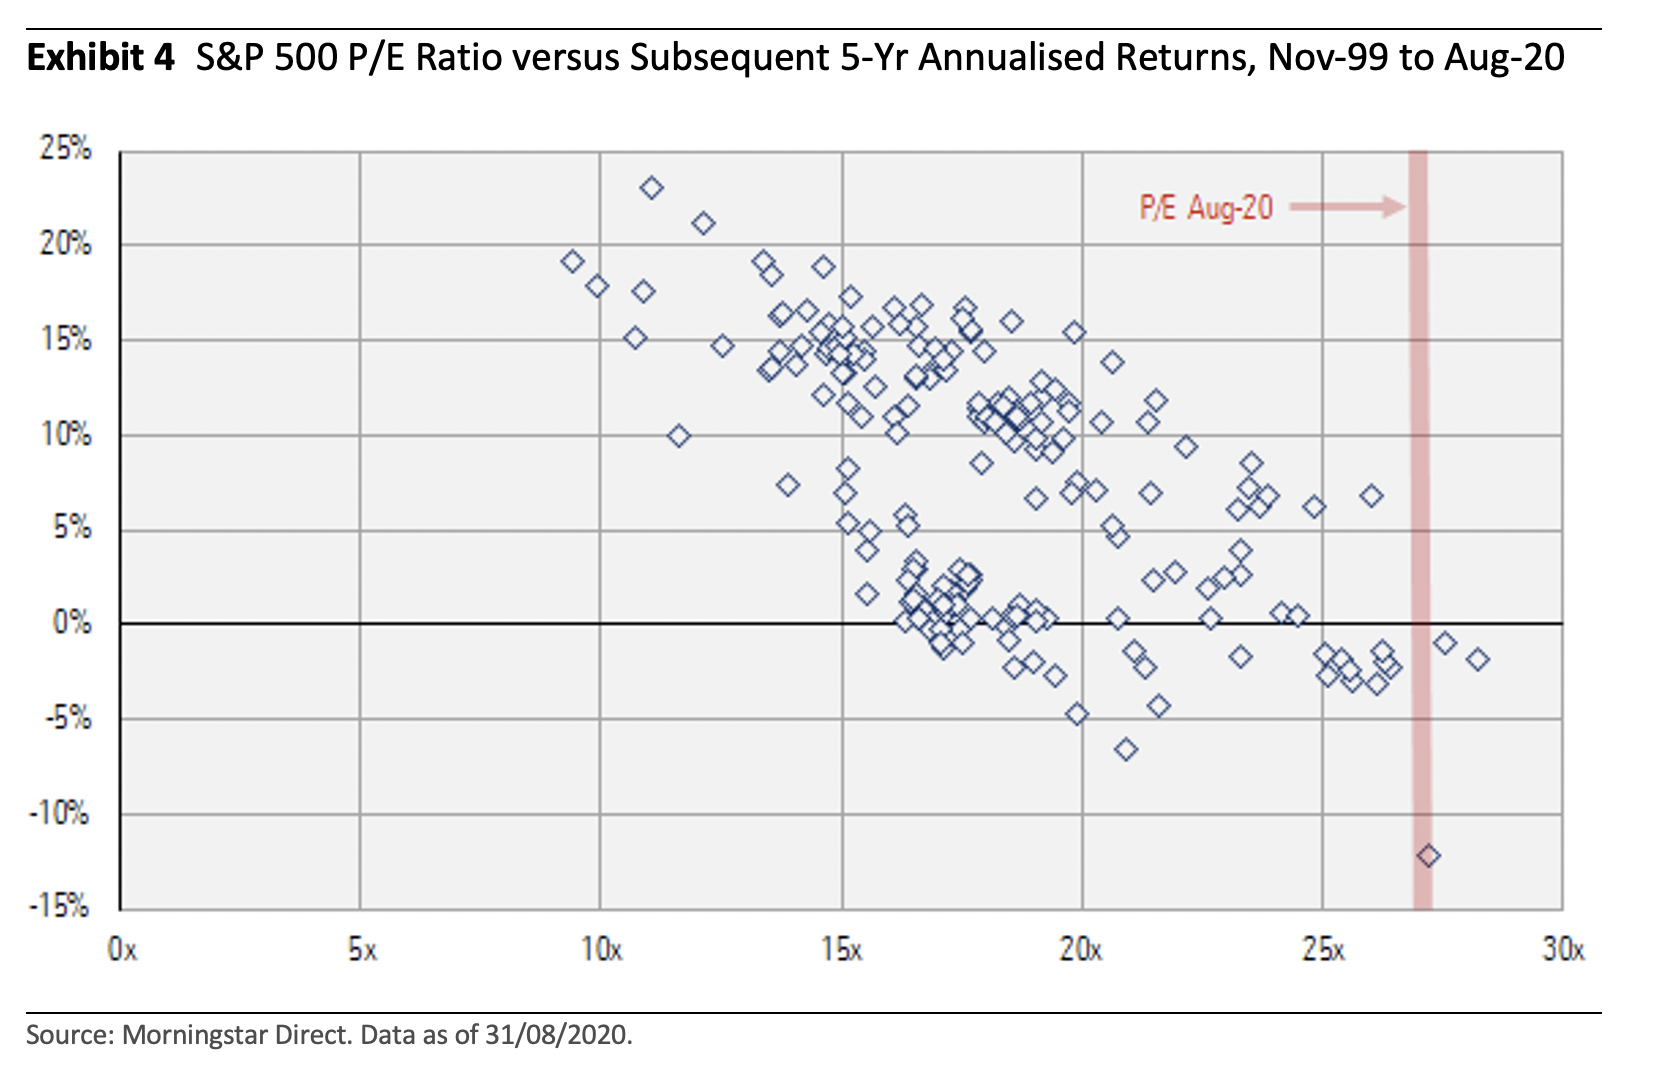
The price-to-earnings ratio is a measure of company value based on current share price and per-share earnings. A high P/E ratio indicates an “expensive” stock and conversely a low P/E ratio indicates a “cheap” one.
At the time of writing, both the strategies are trading towards the top of their historical valuation ranges, meaning they look relatively pricey. In fact, valuations are at levels not seen since the height of the dotcom boom in the early 1990s. That said, from a relative valuation viewpoint, the S&P 500 looks the more attractive of the two.
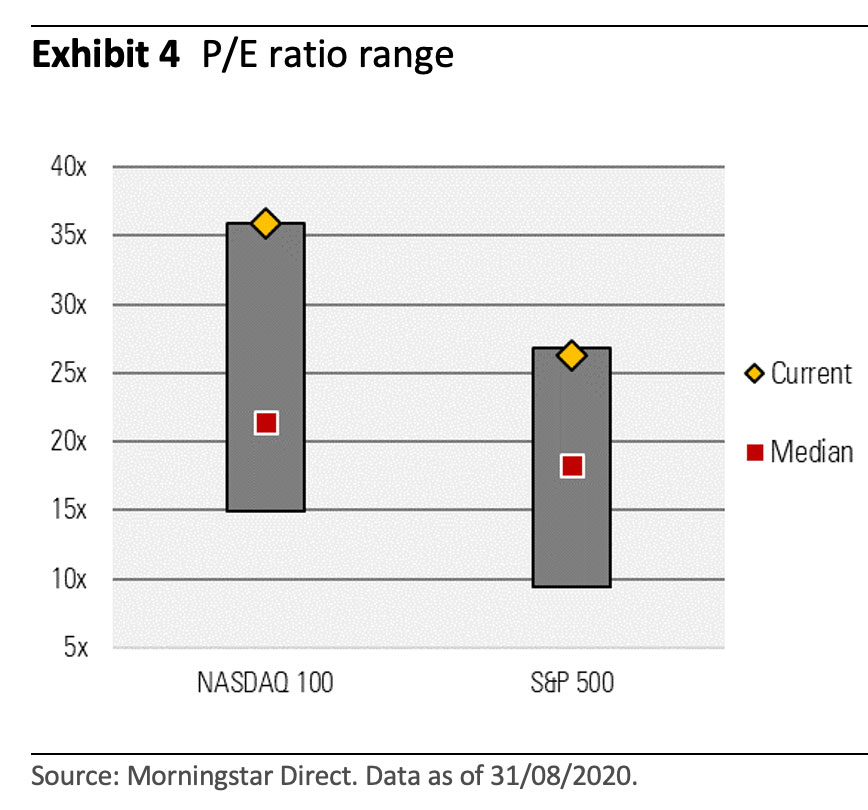
Those considering an investment now may want to pause and consider that research shows that P/E multiples are negatively correlated with long-term returns. This suggests that investors who overpay relative to historic averages are likely to have already missed out on substantial market growth. Value-conscious investors know that returns are inherently tied to the price you pay, with buy-low sell-high generally being the name of the game in equity markets.
These articles are provided for information purposes only. Occasionally, an opinion about whether to buy or sell a specific investment may be provided by third parties. The content is not intended to be a personal recommendation to buy or sell any financial instrument or product, or to adopt any investment strategy as it is not provided based on an assessment of your investing knowledge and experience, your financial situation or your investment objectives. The value of your investments, and the income derived from them, may go down as well as up. You may not get back all the money that you invest. The investments referred to in this article may not be suitable for all investors, and if in doubt, an investor should seek advice from a qualified investment adviser.
Full performance can be found on the company or index summary page on the interactive investor website. Simply click on the company's or index name highlighted in the article.