Why emerging markets equities could trounce US shares
Research Affiliates argues that there is little room for US equity prices to rise from here.
30th January 2020 10:31
by Tom Bailey from interactive investor
Research Affiliates argues that there is little room for US equity prices to rise from here.

Emerging markets should be the best performing equities in the 2020s, according to a new forecast from Research Affiliates, a US company specialising in long-term return predictions across various stock and asset markets.
The company’s report notes that in 2019, US large equities “reigned supreme”, returning investors 28.5% in excess of inflation (when measured in US dollar terms). In comparison, emerging markets returned 16.1%, minus inflation, over the year.
Over the decade, US equities have produced an annualised return of 11.7%. As the chart below shows, the annualised figure for emerging markets has been way below that (when measured in US dollar terms).
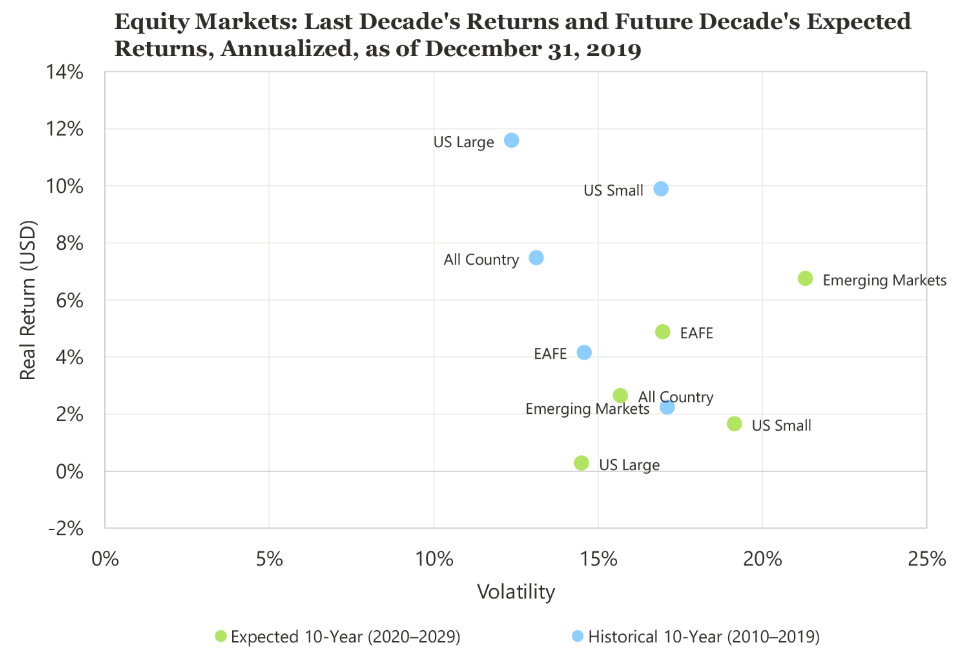
Research Affiliates, however, expects a significant reversal in fortunes in the coming decade. They forecast that US equities will produce an annualised return of just 0.3% above inflation. Emerging markets, meanwhile, should produce an annualised return of 6.8%. EAFE equities (Europe, Australasia and Far East) are in-between, with forecast returns of 4.9% annualised.
The dominant reason for this reversal in performance, says Research Affiliates, is current valuations, based on Robert Shiller’s Cape (cyclically adjusted price-to-earnings) ratio. This valuation measure averages earnings out over a 10-year period. By taking the average for 10 years, the ups and downs of the cycle are evened out. The valuation measure has its critics, one being that it can be slow to recognise economic shifts as it looks back 10 years, but has been an accurate forecaster in the past, most notably predicting shares were at elevated levels ahead of the 2000 and 2007 bear markets.
Research Affiliates explains: “By this measure, and a number of comparable measures, US markets are very expensive relative to history. The current Cape ratio of 30.8, which is the 96th percentile of historical values, is substantially higher than the median historical value of 16.2 and our estimated fair value of 23.1.
“In comparison, emerging market equities are trading at a Cape ratio of 13.4 (the 28th percentile of historical values), below both historical median (15.4) and fair value (14.0, at the 37th percentile).
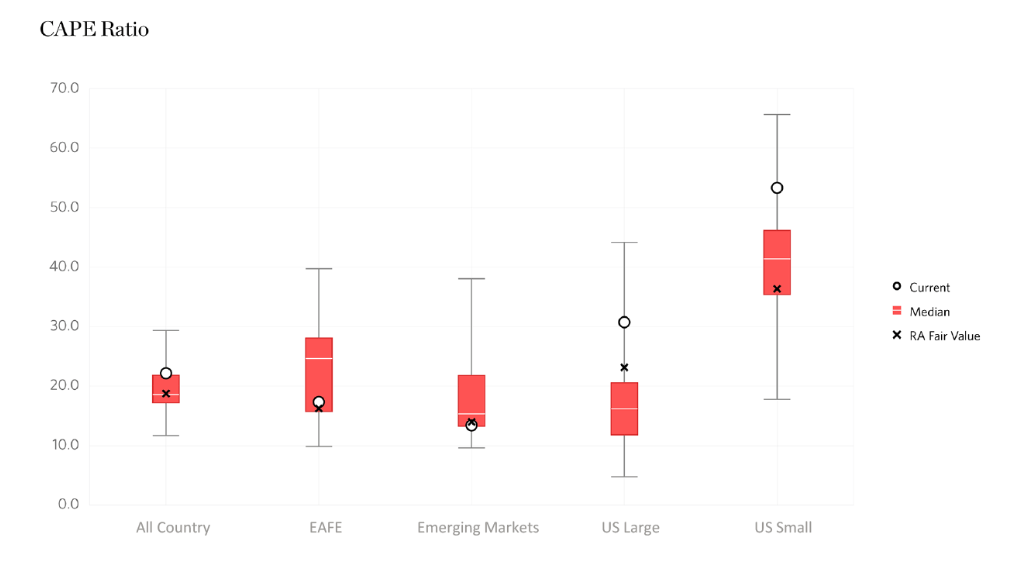
More simply put: the US market is currently trading at stretched valuations, leading Research Affiliates to believe there is little room for equity prices to rise from where they currently are. In contrast, emerging markets are cheap, albeit less cheap than US markets are expensive.
Full performance can be found on the company or index summary page on the interactive investor website. Simply click on the company's or index name highlighted in the article.
This article was originally published in our sister magazine Money Observer, which ceased publication in August 2020.
These articles are provided for information purposes only. Occasionally, an opinion about whether to buy or sell a specific investment may be provided by third parties. The content is not intended to be a personal recommendation to buy or sell any financial instrument or product, or to adopt any investment strategy as it is not provided based on an assessment of your investing knowledge and experience, your financial situation or your investment objectives. The value of your investments, and the income derived from them, may go down as well as up. You may not get back all the money that you invest. The investments referred to in this article may not be suitable for all investors, and if in doubt, an investor should seek advice from a qualified investment adviser.
Full performance can be found on the company or index summary page on the interactive investor website. Simply click on the company's or index name highlighted in the article.