Why it's time to stop running this great portfolio
It's based on well-tested strategies, but this portfolio's 83% return is not worth the effort.
5th July 2019 11:30
by Richard Beddard from interactive investor
It's based on well-tested strategies, but this portfolio's 83% return is not worth the effort.
Nine years ago, we invested an imaginary £30,000 in shares ranked by a formula, to see whether the formula could beat the market.
On a regular basis we refreshed the portfolio, booting out shares that were no longer highly ranked and replacing them with the newest recommendations.
We expected the returns would justify the cost in terms of dealing fees and stamp duty. They would also justify the effort of ranking the shares and accounting for the imaginary trades.
Tracker winner
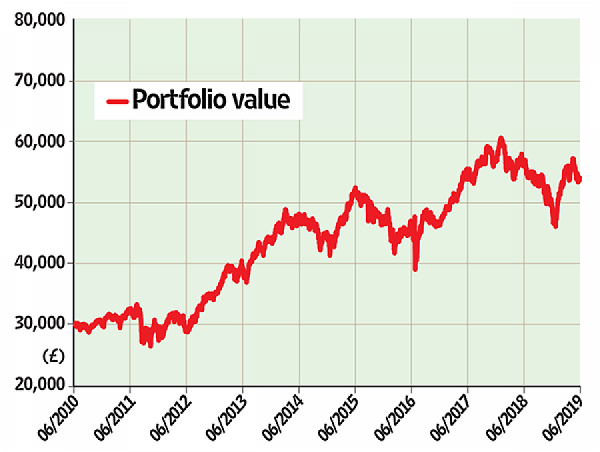
It has not been worth the effort, or the cost. The simplest investment, £30,000 invested in the accumulation units of an index-tracking fund on the day we started the Nifty Thrifty portfolio, is winning. Today, the notional value of the Nifty Thrifty has grown 83% to £54,151, an annualised return of about 7%. An investment in the index tracking fund over the same period would be worth £57,121 today, a gain of about 90% with an annualised return of just over 7%.
This, I am afraid, is capitulation. We have taken the decision to stop what has proved to be a marginally losing strategy. Just so you can see how the last cohort of stocks has performed, the table shows them immediately prior to liquidation.
Our original expectation was that the Nifty Thrifty would do badly some years, but substantially better than an index tracking fund over the long term. We thought we might give it a decade to prove itself, but I cannot face the drudgery of running the algorithm, compiling the tables, accounting for the trades and writing the same article in a year’s time. The Nifty Thrifty might stage a miraculous recovery in the year we have robbed it of, but given the first nine years, I doubt that would give us the confidence to stick with it for another 10.
What went wrong?
Now for the difficult bit. What went wrong, and what can we learn?
There are no easy answers. The algorithm, which seeks out good businesses at cheap prices, had a good pedigree. It was based on two well-tested financial strategies – Joel Greenblatt's Magic Formula, which ranks shares according to their profitability and value, and Piotroski's F-Score, which weeds out firms with deteriorating financials. We drip-fed the money into the market in four quarterly chunks to avoid putting it all at risk at the same time.
So why did it fare badly? The answer may lie in a comparison with a clone of the Nifty Thrifty tracked by our data provider Stockopedia.
Stockopedia's Nifty Thrifty is doing better than the original, having grown nearly 150% since 2012 and produced an annualised return of 12%. It is one of the better-performing of 66 algorithms tracked by the site, although its performance is some way behind the best.
The Stockopedia version has a different start date, it tracks a slightly smaller portfolio of 25 shares, and trades them every quarter rather than once a year. Stockopedia has not meddled with the formula in the expectation of improving it. I, on the other hand, have tweaked it a number of times, albeit sometimes out of necessity because until Stockopedia came along, a few years after we started, the data I had could not reproduce the strategy as faithfully.
Nifty Thrifty was a losing strategy
Slave to the algorithm
You can follow Stockopedia's Nifty Thrifty performance using this link: bit.ly/NiftyThrifty, but note Stockopedia's performance figures do not benefit from dividends and neither are they hindered by trading costs and stamp duty.
I will probably take an occasional interest in Stockopedia's version of the Nifty Thrifty; but I am unlikely to invest in it because I have learned something – and it is not about algorithmic investing, it is about me.
My interest in shares stems from a fascination with business and the wheels of capitalism. Slavishly following an algorithm has not taught me anything about the companies it selects, and it did not bring me much joy even when I thought it might do well.
A final insult: liquidating the portfolio costs money, £10 in broker fees for each share, which is £300 in total and leaves us with £53,851.
An annualised 7% return was a marginal loss against an index tracking fund
| Portfolio | Cost (£) | Value (£) | Return (%) | ||
|---|---|---|---|---|---|
| Cash | 2,572 | ||||
| Shares | 51,579 | ||||
| Since 1 June 2010 | 30,000 | 54,151 | 83% | ||
| Ticker | Shares | Cost (£) | Value (£) | Return (%) | |
| AA. | AA | 723 | 2,371.56 | 392.23 | -76.2 |
| BATS | British American Tobacco | 48 | 1,866.81 | 1,360.32 | -22.1 |
| BDEV | Barratt Developments | 327 | 1,864.22 | 1,811.91 | 5.1 |
| BKG | Berkeley Homes | 61 | 1,951.57 | 2,152.69 | 15 |
| BWY | Bellway | 71 | 1,897.44 | 1,972.38 | 16.6 |
| CARD | Card Factory | 589 | 1,950.44 | 1,142.95 | -31.7 |
| CEY | Centamin | 1148 | 1,949.49 | 1,117.35 | -34.7 |
| CRST | Crest Nicholson | 321 | 1,952.12 | 1,166.51 | -29.4 |
| DC. | Dixons Carphone | 962 | 1,869.22 | 1,126.26 | -34.6 |
| DCG | Dairy Crest Group | 367 | 1,865.3 | 2,277.24 | 22.1 |
| ERM | Euromoney Institutional Investor | 139 | 1,865.21 | 1,808.39 | -1.4 |
| EVR | Evraz | 356 | 1,868.35 | 2,146.32 | 32.2 |
| FXPO | Ferrexpo | 1162 | 1,959.2 | 2,770.79 | 56.3 |
| GFS | G4S | 674 | 1,868.07 | 1,393.5 | -24.1 |
| GOG | Go-Ahead | 107 | 1,957.47 | 1,916.37 | 9.1 |
| HFD | Halfords | 327 | 1,580.47 | 733.13 | -37.1 |
| HWDN | Howden Joinery | 428 | 1,956.83 | 2,174.24 | 14.3 |
| INCH | Inchcape | 249 | 1,863.14 | 1,498.36 | -18.4 |
| ITV | ITV | 1111 | 1,868.55 | 1,202.94 | -30.9 |
| JD. | JD Sports Fashion | 487 | 1,867.94 | 3,087.09 | 65.7 |
| JLT#1 | Jardine Lloyd Thompson | 148 | 1,857.45 | 2,832.72 | 52.5 |
| MGAM | Morgan Advanced Materials | 658 | 1,950.27 | 1,642.37 | -8.4 |
| PETS | Pets at Home | 1181 | 1,960.25 | 2,194.3 | 21 |
| PSN | Persimmon | 80 | 1,938.1 | 1,605.6 | 2.2 |
| RDW | Redrow | 354 | 1,952.54 | 1,966.47 | 9.3 |
| RNK | Rank | 869 | 1,952.36 | 1,353.9 | -24 |
| RTO | Rentokil Initial | 538 | 1,866.78 | 1,996.25 | 8.2 |
| STOB | Stobart | 860 | 1868.29 | 895.26 | -47.2 |
| SVS | Savills | 242 | 1902.25 | 2106.01 | 22.2 |
| WPP | WPP | 179 | 2368.5 | 1735.41 | -12.8 |
Notes: Transaction costs include £10 broker fee, and 0.5% stamp duty where appropriate. Cash earns no interest. Dividends and sale proceeds are credited to the cash balance. £30,000 invested on 1 June 2010 would be worth £54,151 today. £30,000 invested in FTSE 350 index tracker accumulation units would be worth £57,121 today Source: SharePad, 4 June 2019.
These articles are provided for information purposes only. Occasionally, an opinion about whether to buy or sell a specific investment may be provided by third parties. The content is not intended to be a personal recommendation to buy or sell any financial instrument or product, or to adopt any investment strategy as it is not provided based on an assessment of your investing knowledge and experience, your financial situation or your investment objectives. The value of your investments, and the income derived from them, may go down as well as up. You may not get back all the money that you invest. The investments referred to in this article may not be suitable for all investors, and if in doubt, an investor should seek advice from a qualified investment adviser.
Full performance can be found on the company or index summary page on the interactive investor website. Simply click on the company's or index name highlighted in the article.
Disclosure
We use a combination of fundamental and technical analysis in forming our view as to the valuation and prospects of an investment. Where relevant we have set out those particular matters we think are important in the above article, but further detail can be found here.
Please note that our article on this investment should not be considered to be a regular publication.
Details of all recommendations issued by ii during the previous 12-month period can be found here.
ii adheres to a strict code of conduct. Contributors may hold shares or have other interests in companies included in these portfolios, which could create a conflict of interests. Contributors intending to write about any financial instruments in which they have an interest are required to disclose such interest to ii and in the article itself. ii will at all times consider whether such interest impairs the objectivity of the recommendation.
In addition, individuals involved in the production of investment articles are subject to a personal account dealing restriction, which prevents them from placing a transaction in the specified instrument(s) for a period before and for five working days after such publication. This is to avoid personal interests conflicting with the interests of the recipients of those investment articles.
This article was originally published in our sister magazine Money Observer, which ceased publication in August 2020.
These articles are provided for information purposes only. Occasionally, an opinion about whether to buy or sell a specific investment may be provided by third parties. The content is not intended to be a personal recommendation to buy or sell any financial instrument or product, or to adopt any investment strategy as it is not provided based on an assessment of your investing knowledge and experience, your financial situation or your investment objectives. The value of your investments, and the income derived from them, may go down as well as up. You may not get back all the money that you invest. The investments referred to in this article may not be suitable for all investors, and if in doubt, an investor should seek advice from a qualified investment adviser.
Full performance can be found on the company or index summary page on the interactive investor website. Simply click on the company's or index name highlighted in the article.