Why this is a massive day for the FTSE 100 index
Like sailors, investors can use charts to navigate choppy waters. Here are some big numbers to watch.
28th May 2020 11:52
by Lee Wild from interactive investor
Like sailors, investors can use charts to navigate choppy waters. Our head of equity strategy explains the big numbers to watch.
Like many of you, I have been following the stock market’s reaction to the pandemic like a hawk, looking for trends or signs that indicate what might happen next. And, once the dust had settled after the initial crash, a clear pattern of behaviour did eventually emerge.
Thankfully, you do not need a crystal ball to identify possible future market moves, although it does require a faith in charting, or technical analysis. I have heard the argument against charting many times, including the amusing claim that “charts are for sailors!”.
There are some who rely solely on charts to trade, but I prefer to use them as an additional aid to making investment decisions alongside fundamental analysis of the underlying business. Technical analysis can indicate levels at which the share price may see support or resistance, a useful tool in deciding entry and exit points for an investment, or for placing stop-loss orders.
Now, with the FTSE 100 up over 540 points, or 9.6%, in just two weeks, and at its highest since 10 March when the crash was still in full swing, it is worth taking a close look at what the charts are telling us about the direction markets might take in the days and weeks ahead.
My FTSE 100 chart
It was only possible for me to identify potentially important levels for the FTSE 100 index once the initial sell-off and subsequent volatility had died down.
The index peaked at 7,480 on 20 February, just before major selling took hold. By 16 March, it was trading just below 4,900 for a drop of 2,580 points, or 34.5%. In the following days it was unclear whether this was indeed the bottom, or if the market might lurch lower again.
Despite regular selling pressure, the FTSE 100 did not trouble that low again. Instead, a strong upward move on 23 March proved the beginning of a rally from 4,994 to 5,815 three days later, a gain of 16.4%.
Even then, extreme volatility amid uncertainty around the pandemic and its impact both on global health and the economy, meant it was not until the end of April that I became more confident in the ability of charts to call this market. Now I could have more faith in the lines I’d drawn on the chart. I’ll explain the coloured lines in the next section.
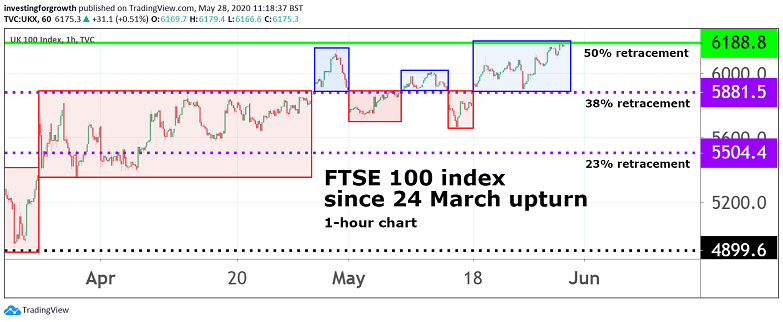
Source: TradingView. Past performance is not a guide to future performance.
Mr Fibonacci identifies the right levels
Assuming that 7,480 was the high and 4,900 the low of this market move, I drew a Fibonacci retracement pattern for the FTSE 100 using a charting software package. By dividing the vertical distance by the key Fibonacci ratios of 23.6%, 38.2%, 50%, 61.8%, 78.6% and 100%, I generated key price levels for investors to watch. At these levels, stocks might meet resistance if they are rising, or find support if they are falling.
For us, the key levels are the 38% retracement of the decline from high to low at around 5,881 (purple dotted line on the chart below), and the 50% retracement level at 6,188 (green line on the chart below), which indicates that the FTSE 100 has recovered half its losses suffered since the crash began. It is worth noting that markets rarely stop precisely on a level, so a degree of leeway and judgment is required here.
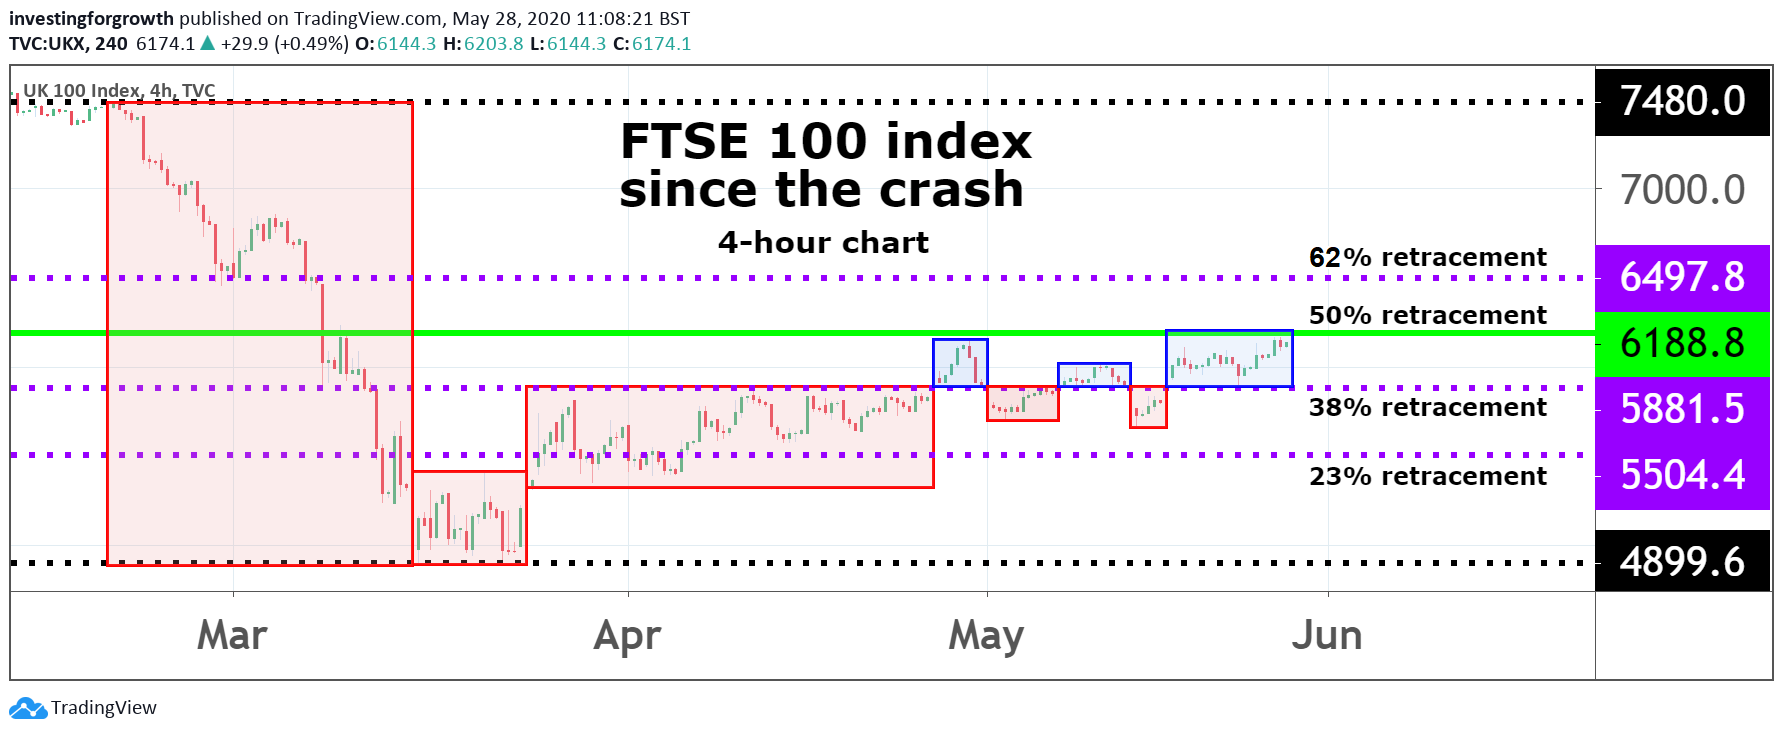
Source: TradingView. Past performance is not a guide to future performance.
Monitoring price movements at both four- and one-hour intervals, the FTSE broke above 5,881 on 28 April. It had tested that area two weeks earlier, which had provided a hint that this was the chart pattern to follow. Subsequent dramatic breaks above and below the 38% retracement line, and so-called ‘kisses’ against the line as either support or resistance, were tell-tale signs that this was the area to watch.
Today, on 28 May, the FTSE 100 has broken above the major resistance point at the 50% Fibonacci retracement level. As I write, the day’s high is 6,203. That in itself is significant, although it will prove more exciting if the index closes above the 50% retracement. While not always the case, it at least implies a greater chance of extending the rally above the line.
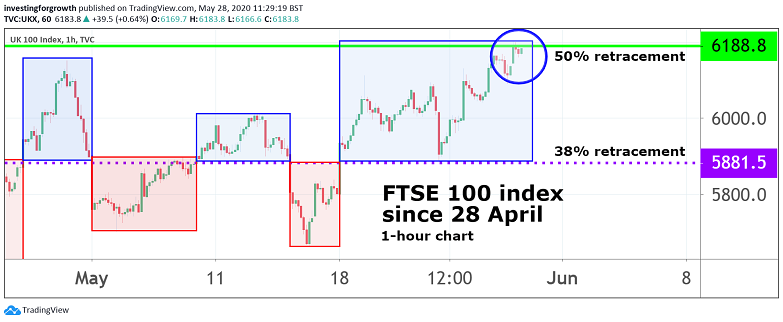
Source: TradingView. Past performance is not a guide to future performance.
Interestingly, there is clearly resistance at this level, and the index has pulled back to 6,165 late morning.
If the index does make a break above the 50% line stick, the next resistance point is the 62% retracement level at around 6,491. Theoretically, the area around 6,188 should now act as a level of support. There are clearly negative implications if it doesn't. It's worth noting that the index spiked above that line briefly on 10 March, only to resume its rapid descent.
Please bear in mind that these are my observations about recent market behaviour and some price points that might prove significant in the future. I believe charts are best used alongside other investment strategies and might not be appropriate for all investors. If you are interested in technical analysis, please do further research and use charts only when you understand how best to exploit them.
Full performance can be found on the company or index summary page on the interactive investor website. Simply click on the company's or index name highlighted in the article.
These articles are provided for information purposes only. Occasionally, an opinion about whether to buy or sell a specific investment may be provided by third parties. The content is not intended to be a personal recommendation to buy or sell any financial instrument or product, or to adopt any investment strategy as it is not provided based on an assessment of your investing knowledge and experience, your financial situation or your investment objectives. The value of your investments, and the income derived from them, may go down as well as up. You may not get back all the money that you invest. The investments referred to in this article may not be suitable for all investors, and if in doubt, an investor should seek advice from a qualified investment adviser.
Full performance can be found on the company or index summary page on the interactive investor website. Simply click on the company's or index name highlighted in the article.