Is Babcock slump overdone?
19th July 2018 14:20
by Graeme Evans from interactive investor
Babcock shares have been great performers since February, but have suffered double-digit losses today. Graeme Evans examines recovery prospects.

Having steamed ahead for much of 2018, Babcock International shares are back trading in choppy waters.
Today’s blow for the support services firm follows its AGM warning that defence-based revenues have been hit by restructuring at the MoD's Defence Equipment & Support agency. This has led to a review of programme spend timings and contributed to slower UK activity levels in its Marine and Land arms.
Shares sunk 11%, adding to the jittery performance seen since the FTSE 250 stock peaked at 862p in mid-June. Given that shares previously rose by a third between February and June, this has led to inevitable questions about whether today's sell-off is overdone and if the company is now a buying opportunity.
Certainly, it looks like Babcock hasn't lost support in the City. JP Morgan Cazenove stuck by its 998p price target today, while Stifel and Jefferies both remain at 950p.
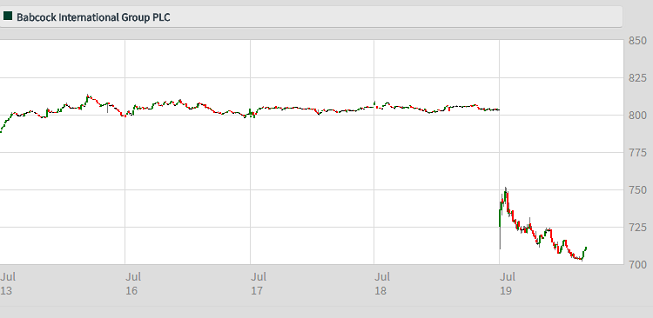
Source: interactive investor Past performance is not a guide to future performance
Stifel points to a number of positive elements in today's statement, not least that earnings guidance remains unchanged despite the reduced sales expectations in the Marine and Land sectors.
Babcock's order book also continues to grow, with the bid pipeline up from £13 billion at the time of May's annual results to £14 billion today. The majority of the increase comes from new marine opportunities, suggesting that the sales blip in this trading segment is temporary. Around 83% of expected group revenue is also in place for this financial year, with around 55% for 2018/19.
Stifel said: "Fundamentally, Babcock is a business underpinned by some attractive characteristics, operating in broadly defensive markets and with significant opportunities to grow overseas."
Even before today's AGM update, they said Babcock's valuation was not stretching, with the group trading on a 2019 price earnings multiple of 9x and a dividend yield of about 4%. The free cash flow (FCF) yield of 7.5% represents another sign of value, Stifel said.
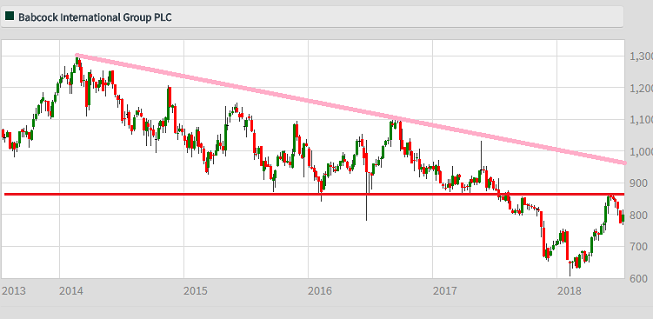
Source: interactive investor Past performance is not a guide to future performance
In May's annual results, Babcock highlighted a strengthening balance sheet after a year in which it achieved record underlying revenues and profits, despite political and economic uncertainty. Net debt reduced 5% to £1.1 billion and Babcock increased its dividend for the 17th consecutive year — up 4.8% to 29.5p.
It added today that it remained on course to achieve a year-end net debt to underlying earnings ratio of around 1.4 times.
Forecasts for Babcock's Aviation and Nuclear divisions remain unchanged, with the company recently beginning its HADES contract to provide technical support at 17 RAF air bases.
Crucially, the prospect of a year-in-year reduction in Marine revenues for the first half of the year is being offset by plans for the disposal of low margin, non-strategic businesses.
JP Morgan Cazenove said: "Our price target is unchanged and we remain overweight given the relatively high value type of service provided versus peers and a 8% FCF yield."
These articles are provided for information purposes only. Occasionally, an opinion about whether to buy or sell a specific investment may be provided by third parties. The content is not intended to be a personal recommendation to buy or sell any financial instrument or product, or to adopt any investment strategy as it is not provided based on an assessment of your investing knowledge and experience, your financial situation or your investment objectives. The value of your investments, and the income derived from them, may go down as well as up. You may not get back all the money that you invest. The investments referred to in this article may not be suitable for all investors, and if in doubt, an investor should seek advice from a qualified investment adviser.
Full performance can be found on the company or index summary page on the interactive investor website. Simply click on the company's or index name highlighted in the article.