Is this Centrica trend too good to ignore?
With Centrica shares on the ropes, a “remarkable” price move has piqued the interest of our chartist.
28th February 2019 09:37
by Alistair Strang from Trends and Targets
With Centrica shares on the ropes, a "remarkable" price move has piqued the interest of our chartist.

Centrica (LSE:CNA)
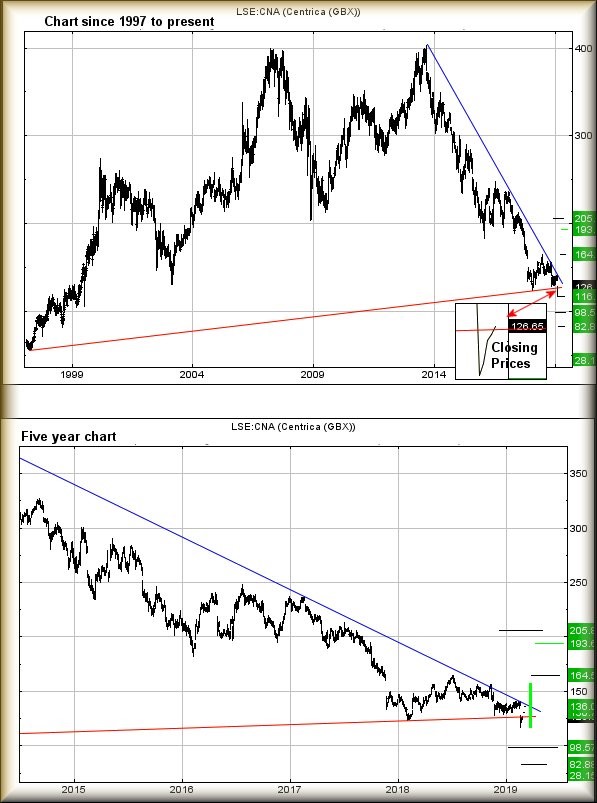
Something quite remarkable is going on with Centrica (LSE:CNA). Of course, perhaps it's only remarkable from our perspective but we cannot ignore the share's chart has a red line which goes back to the dawn of time. Perhaps we're seeing the market pretend confidence in Brexit, or perhaps there's some sort of calibration error in our numbers (there isn't).
Essentially, the headline comes due to the share closing yesterday at 126.65p. And the share price uptrend (since 1997!) is sitting at 126.565p roughly. This obviously means Centrica has regained its historical uptrend by a staggering 85/1000th of a penny. Of course, this may indeed reflect levels of confidence in the UK's current Brexit stance - not a lot.
However, we dare not eschew such a movement. Too often, these little nudges in the right direction end up being meaningful. Thus, the immediate situation suggests any near-term movement bettering 127.15p should attack an initial 130.75p.
We've not shown this on the chart, due to scaling issues but the ambition does not come close to exceeding blue, the long-term downtrend from 2013.
Our secondary target, should such a modest ambition be bettered, calculates at 136p and amazingly, coincides on the bottom chart with both blue and the fat green vertical line, representing the current date for Brexit.
If we're cynical, there certainly seems to be a chance the price shall be permitted to drift uselessly upward until the coming appointment with the apocalypse.
In the case of Centrica, only with closure above 136p shall we dare express a hope it's going to recover to an initial 164p. If bettered, secondary calculates at a longer term 193p.
For now though, we suspect it shall continue flirting with the blue trend line and only show direction, if true direction is shown by Brexit.
Finally, there's a problem at 116p. Should the price stumble below such a point, it's probably stuffed and will head to an initial 98p. Secondary, when broken, calculates at 82p. Ultimate bottom, in the event of some really grotty news, is down at 28p.
Source: Trends and Targets Past performance is not a guide to future performance
Alistair Strang has led high-profile and "top secret" software projects since the late 1970s and won the original John Logie Baird Award for inventors and innovators. After the financial crash, he wanted to know "how it worked" with a view to mimicking existing trading formulas and predicting what was coming next. His results speak for themselves as he continually refines the methodology.
Alistair Strang is a freelance contributor and not a direct employee of Interactive Investor. All correspondence is with Alistair Strang, who for these purposes is deemed a third-party supplier. Buying, selling and investing in shares is not without risk. Market and company movement will affect your performance and you may get back less than you invest. Neither Alistair Strang or Interactive Investor will be responsible for any losses that may be incurred as a result of following a trading idea.
These articles are provided for information purposes only. Occasionally, an opinion about whether to buy or sell a specific investment may be provided by third parties. The content is not intended to be a personal recommendation to buy or sell any financial instrument or product, or to adopt any investment strategy as it is not provided based on an assessment of your investing knowledge and experience, your financial situation or your investment objectives. The value of your investments, and the income derived from them, may go down as well as up. You may not get back all the money that you invest. The investments referred to in this article may not be suitable for all investors, and if in doubt, an investor should seek advice from a qualified investment adviser.
Full performance can be found on the company or index summary page on the interactive investor website. Simply click on the company's or index name highlighted in the article.