Chart analysis: bitcoin, Lloyds Bank, Barclays, Kingfisher
Our analyst reviews bitcoin's latest movement and where it’s heading next, plus these three blue-chips.
1st July 2019 09:10
by Alistair Strang from Trends and Targets
Our analyst reviews bitcoin's latest movement and where it’s heading next, plus these three blue-chips.

Bitcoin, Barclays, Lloyds, Kingfisher
We're opting to start the week with an update on items reviewed last week and anything else which takes our fancy.
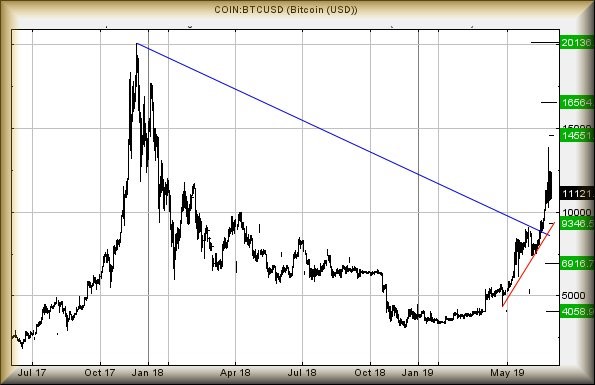
To deal with bitcoin, what happened proved quite fascinating from our nerdy perspective. At 5:30pm on Wed 26th, it achieved our 13,286 dollars.
Better still, the phony currency exceeded target on the first surge, hitting $13,292 before sharply falling back to target level. This (thankfully) confirmed we'd been monitoring the correct trend but, such was the pace of bitcoin acceleration, that next time it exceeded our target level, the price powered on upward to $13,880. And then, it dropped like a stone, almost feeling like the market "knew" it had gone too high and needed stuffing back under its rock.
The immediate problem is fairly straightforward. At present, it's trading around the $11,000 level, needing below $10,200 to enter a cycle down to $9,300 and ideally a proper rebound.
It now requires - according to our criteria anyway - to trade above $12,925 as this calculates as entering a cycle to an initial 13,980 dollars. If bettered, secondary is at $14,550 and a new high since it broke an important downtrend. This sort of thing takes the price firmly into a region where a "long term - or later that day" target of $16,560 looks pretty certain to provoke some hesitation in any further upward surge.

Source: Trends and Targets Past performance is not a guide to future performance
Kingfisher (LSE:KGF) appear to be doing something worthwhile. Our report (link here) mentioned the importance of the price bettering 222p anytime soon, as it takes the share into a region with an initial 235p and beyond. From the point at which it closed last week, it should prove worth watching in the days ahead.
Barclays (LSE:BARC) theoretically does not need discussing as the share price continues to wobble around in a zombie state. While our report (link here) demands it better 162p to be taken seriously, it will probably be worth watching for trades exceeding 152p in the week ahead, due to an initial 157p looking possible with secondary 160p. While neither is sufficient to remove the share from Big Picture trouble, it will illustrate rather neatly the reality of prices rarely going straight up or down.
Lloyds Banking Group (LSE:LLOY) assiduously avoided breaking below our 56p trigger level (Report link here) but to be honest, we've little confidence in the price. However, Friday's session commenced with a peculiar price movement, one which apparently calculates with near-term movement above the days high of 57.43 being capable of some growth to a pretty tame looking 59.12p. If exceeded, secondary is at 60.3p. As explained with Barclays above, neither target proves sufficient to extract the share price from danger.
Alistair Strang has led high-profile and "top secret" software projects since the late 1970s and won the original John Logie Baird Award for inventors and innovators. After the financial crash, he wanted to know "how it worked" with a view to mimicking existing trading formulas and predicting what was coming next. His results speak for themselves as he continually refines the methodology.
Alistair Strang is a freelance contributor and not a direct employee of Interactive Investor. All correspondence is with Alistair Strang, who for these purposes is deemed a third-party supplier. Buying, selling and investing in shares is not without risk. Market and company movement will affect your performance and you may get back less than you invest. Neither Alistair Strang or Interactive Investor will be responsible for any losses that may be incurred as a result of following a trading idea.
These articles are provided for information purposes only. Occasionally, an opinion about whether to buy or sell a specific investment may be provided by third parties. The content is not intended to be a personal recommendation to buy or sell any financial instrument or product, or to adopt any investment strategy as it is not provided based on an assessment of your investing knowledge and experience, your financial situation or your investment objectives. The value of your investments, and the income derived from them, may go down as well as up. You may not get back all the money that you invest. The investments referred to in this article may not be suitable for all investors, and if in doubt, an investor should seek advice from a qualified investment adviser.
Full performance can be found on the company or index summary page on the interactive investor website. Simply click on the company's or index name highlighted in the article.