Chart of the week: Did FTSE 100 peak last week?
With the bullish picture changing very rapidly, our chartist sets a new target for the blue-chip index.
25th March 2019 12:55
by John Burford from interactive investor
With the bullish picture changing very rapidly, our chartist sets a new target for the blue-chip index.
With the tumultuous and volatile market action in the share markets last week, I thought I would update my outlook for the FTSE 100 index at this opportune time.
I have noted that for the past five times, market highs have coincided with the date of the equinox to within a decent tolerance. Although the FTSE and the US indexes contain vastly different companies, they do tend to trade more or less together since they are driven by the same force – sentiment.
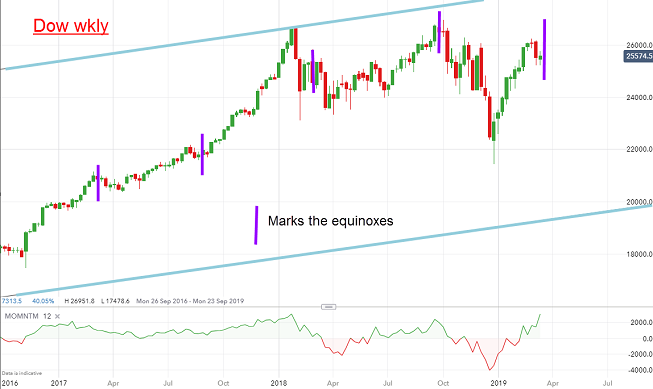
I have been tracking the Dow closely this month, and this is the chart I compiled a few weeks ago marking the equinox dates in March and September each year:
Source: interactive investor Past performance is not a guide to future performance
And guess what? Isn't it remarkable that market highs lie on or close to the equinoxes? And bingo! - another accurate hit was made last week with the Dow making a high at 4pm last Tuesday – one day before the Vernal Equinox (as of Friday's close, the Dow is off 500 points).
With this evidence, we must conclude that some changes are afoot at these times of the year. So why should markets turn at the equinox? That's a good question! But they do.
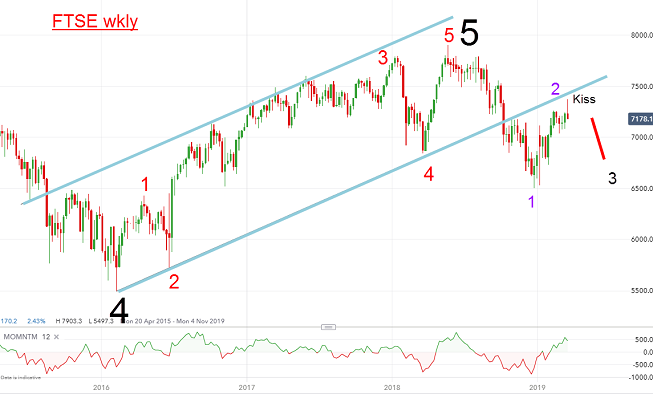
How does this relate to the FTSE performance? Let me back up and analyse the long-term weekly chart:
Source: interactive investor Past performance is not a guide to future performance
From the 2016 low (wave 4), the market rallied in the final wave 5 in five smaller waves – and crucially inside the trading channel described by my blue tramlines. That wave 5 of 5 high was made in May at the 7,900 level, and it has been downhill since then – bar the post-Christmas rally.
Note that the lower tramline break was made in October, then fell to a low below 6,600 at Christmas and then staged the counter-trend bounce to the 7,370 high on Thursday – and that level is a precise Fibonacci 62% retrace of the entire move off the all-time high (ATH). And that is the level where most counter-trend moves fizzle out.
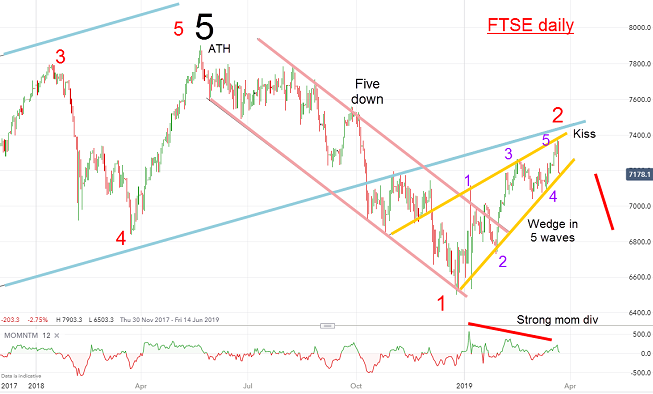
Here is the daily chart of recent action:
Source: interactive investor Past performance is not a guide to future performance
This is a very interesting chart! I have my long-term blue tramlines, the medium-term pink tramlines and a short-term yellow wedge (in the classic five wave form).
And Friday's heavy selling brought the market to the lower wedge line after planting a kiss on Thursday. The formerly bullish picture is changing very rapidly before our eyes!
With the rally high and kiss set on Thursday (one day after the Vernal Equinox), is the FTSE also displaying the 'Equinox Effect'?
Note the weakening momentum at each high all the way up the post-Christmas rally - a sure sign of a counter-trend bounce and a reliable forerunner of a sharp correction - in this case down - that may have started on Friday.
This is not a bullish scenario. In fact, it has the potential to see the FTSE rapidly descend to the wave 1 low at 6,600 – and beyond - in a large third wave.
John Burford is the author of the definitive text on his trading method, Tramline Trading. He is also a freelance contributor and not a direct employee of interactive investor.
These articles are provided for information purposes only. Occasionally, an opinion about whether to buy or sell a specific investment may be provided by third parties. The content is not intended to be a personal recommendation to buy or sell any financial instrument or product, or to adopt any investment strategy as it is not provided based on an assessment of your investing knowledge and experience, your financial situation or your investment objectives. The value of your investments, and the income derived from them, may go down as well as up. You may not get back all the money that you invest. The investments referred to in this article may not be suitable for all investors, and if in doubt, an investor should seek advice from a qualified investment adviser.
Full performance can be found on the company or index summary page on the interactive investor website. Simply click on the company's or index name highlighted in the article.
Disclosure
We use a combination of fundamental and technical analysis in forming our view as to the valuation and prospects of an investment. Where relevant we have set out those particular matters we think are important in the above article, but further detail can be found here.
Please note that our article on this investment should not be considered to be a regular publication.
Details of all recommendations issued by ii during the previous 12-month period can be found here.
ii adheres to a strict code of conduct. Contributors may hold shares or have other interests in companies included in these portfolios, which could create a conflict of interests. Contributors intending to write about any financial instruments in which they have an interest are required to disclose such interest to ii and in the article itself. ii will at all times consider whether such interest impairs the objectivity of the recommendation.
In addition, individuals involved in the production of investment articles are subject to a personal account dealing restriction, which prevents them from placing a transaction in the specified instrument(s) for a period before and for five working days after such publication. This is to avoid personal interests conflicting with the interests of the recipients of those investment articles.