Chart of the week: expect a bumpy ride with oil shares
Any further increases will be hard-won, and reversals are likely.
18th January 2021 12:37
by John Burford from interactive investor
Any further increases will be hard-won, and reversals are likely.

Since my highly contrarian bullish call on crude oil and the oil majors in my article of 19 October, both sectors have been very accurately following the road map I set out then.
I followed that call up with another bullish call in my article of 14 December. And, since October, BP (LSE:BP.) has gained a handy 50% from the £2 area to the current £3-plus region.
But late last week I noted that many markets that relate to the oil sector - including the FTSE 100 - have reached important Fibonacci targets at the same time.
This is likely warning us to expect a bumpier ride ahead, if not significant reversals lower.
Here are some charts with comments:
Source: interactive investor. Past performance is not a guide to future performance.
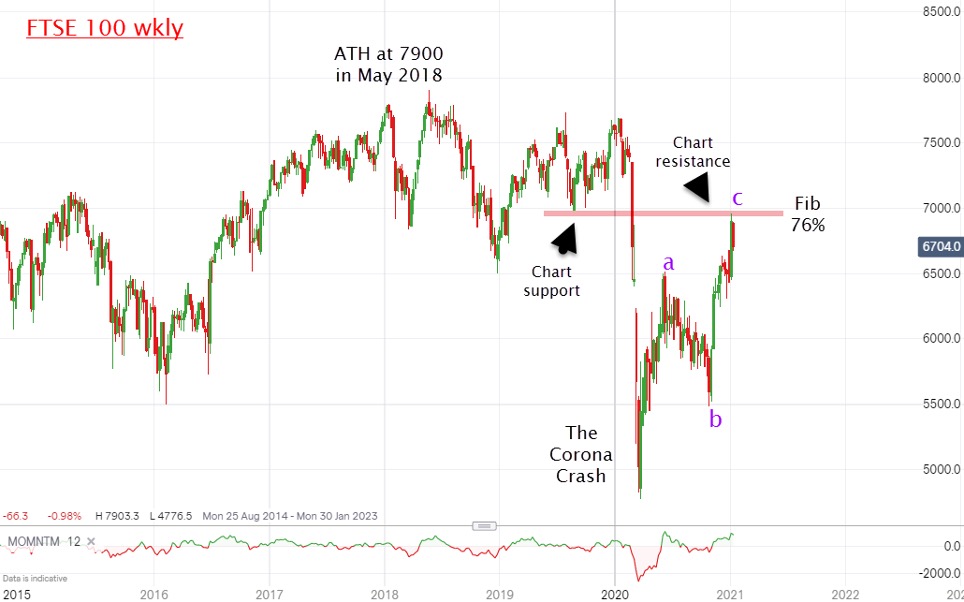
The FTSE has rallied only to the Fibonacci 76% retrace of the coronavirus crash wave in a clear three-wave pattern and into chart resistance. Remember, a three-wave pattern is always corrective to the one larger trend (down here).
I believe the current 6,900 area is a significant zone of resistance. Any further upside progress will be very hard-won, as the market would have to eat into the substantial overhanging trading zone above. Odds are high a decent reversal is coming.
Source: interactive investor. Past performance is not a guide to future performance.
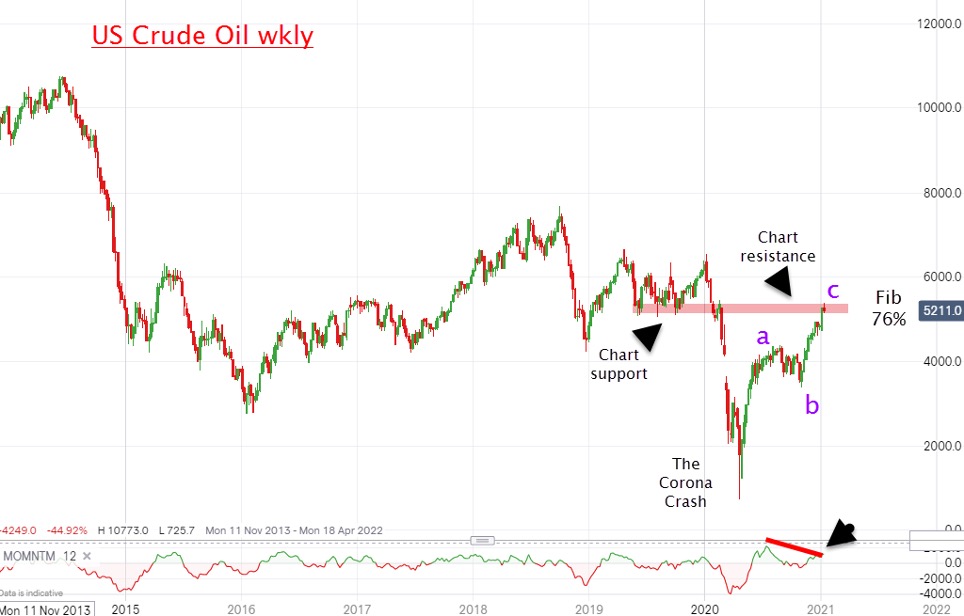
US crude oil has also rallied to the Fibonacci 76% retrace of its coronavirus crash wave downwards, and also showed a clear ‘three-up’ pattern. This time, we have a sharp negative momentum divergence. That is a potentially bearish set-up.
My alternate scenario is that instead of a ‘three-up’ we have the start of a larger ‘five-up’ taking crude to test the highs of 2018-19 in the $70-$80 (£51.70-£59) area. Either way, I place good odds on at least a major pause around current levels ($52).
Source: interactive investor. Past performance is not a guide to future performance.
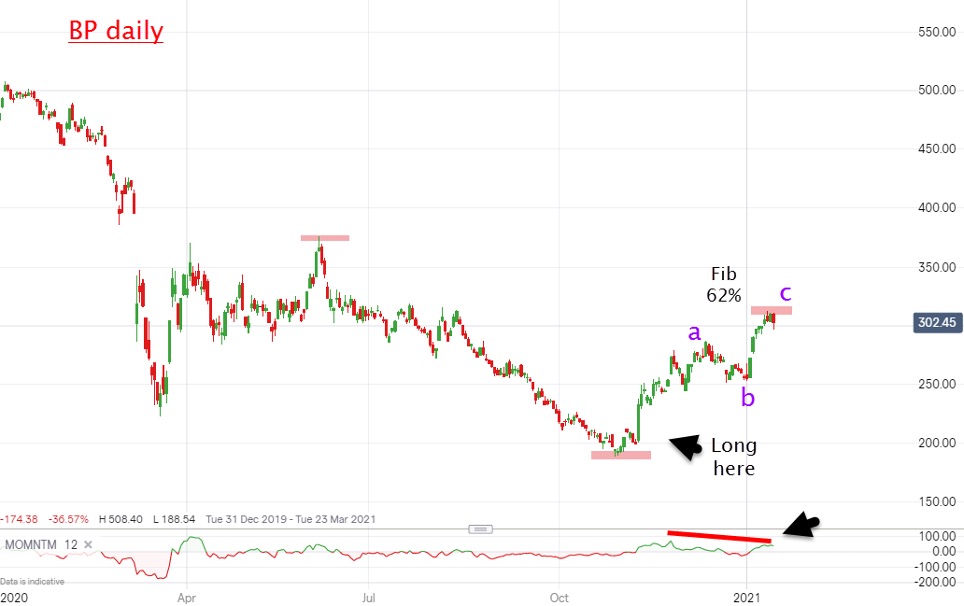
My road map last year called for a dip and then a strong push up towards my target of around £3.50. Last week it made it to £3.12.
But it has reached the important Fibonacci 62% retrace on a good momentum divergence. That sets the scene for a possible decent downward correction,
- How alternative energy beat oil and gas on AIM in 2020
Are you saving enough for retirement? Our calculator can help you find out
Adding all this evidence up, it is clear that shorter-term traders should be looking to bank some profits here. The above warnings are just too worrying!
Of course, the above markets could shoot up past their current resistance levels. That would largely depend on markets amplifying their existing highly euphoric post-vaccine scenario. If we see global travel restrictions lifted soon, that would boost fuel demand in the near term and could provide a tailwind to prices.
But I see other clouds in the sky. I see signs the poster child of rampant speculation – Tesla (NASDAQ:TSLA) (with a price-to-earnings ratio of more than 200!) – is showing signs of buyer exhaustion.
If those shares stage a decent sell-off, that would be a major signal that the mood for unbridled speculation has switched to a darker tone – and many shares would likely suffer.
John Burford is the author of the definitive text on his trading method, Tramline Trading. He is also a freelance contributor and not a direct employee of interactive investor.
These articles are provided for information purposes only. Occasionally, an opinion about whether to buy or sell a specific investment may be provided by third parties. The content is not intended to be a personal recommendation to buy or sell any financial instrument or product, or to adopt any investment strategy as it is not provided based on an assessment of your investing knowledge and experience, your financial situation or your investment objectives. The value of your investments, and the income derived from them, may go down as well as up. You may not get back all the money that you invest. The investments referred to in this article may not be suitable for all investors, and if in doubt, an investor should seek advice from a qualified investment adviser.
Full performance can be found on the company or index summary page on the interactive investor website. Simply click on the company's or index name highlighted in the article.
Disclosure
We use a combination of fundamental and technical analysis in forming our view as to the valuation and prospects of an investment. Where relevant we have set out those particular matters we think are important in the above article, but further detail can be found here.
Please note that our article on this investment should not be considered to be a regular publication.
Details of all recommendations issued by ii during the previous 12-month period can be found here.
ii adheres to a strict code of conduct. Contributors may hold shares or have other interests in companies included in these portfolios, which could create a conflict of interests. Contributors intending to write about any financial instruments in which they have an interest are required to disclose such interest to ii and in the article itself. ii will at all times consider whether such interest impairs the objectivity of the recommendation.
In addition, individuals involved in the production of investment articles are subject to a personal account dealing restriction, which prevents them from placing a transaction in the specified instrument(s) for a period before and for five working days after such publication. This is to avoid personal interests conflicting with the interests of the recipients of those investment articles.