Chart of the week: A fallen star stock in recovery mode?
After fighting back following a massive sell-off, this analyst tells us what he thinks will happen next.
18th November 2019 11:32
by John Burford from interactive investor
After fighting back following a massive sell-off, technical analyst John Burford tells us what he thinks will happen next to this popular share.

NVIDIA at a crossroads
NVIDIA (NASDAQ:NVDA) is constantly in the news as its specialist graphics cards are powering some of the most popular computer games including the best-selling Minecraft. It also provides chips for cryptocurrency mining operations and for the autonomous vehicle sector.
And its recent trading results were considered excellent by pundits, although earnings per share (EPS) were way down on last year. So, with the games industry showing few signs of flagging, why am I bearish on the shares? Most analysts see only blue skies ahead, and that is keeping my contrarian antennae twitching.
Remember, it is when the consensus is uber-bullish that reversals are often made. To many, this sounds counter-intuitive. But then, financial markets often seem perverse, do they not?
The price chart shows a typical pattern for a 'story' share. They rose from the $20's when the company was an infant to the peak near $300 last October. But then, a Crypto Winter set in as bitcoin prices plunged and mining became uneconomical.
That little episode induced selling and this is the position today on the weekly chart:
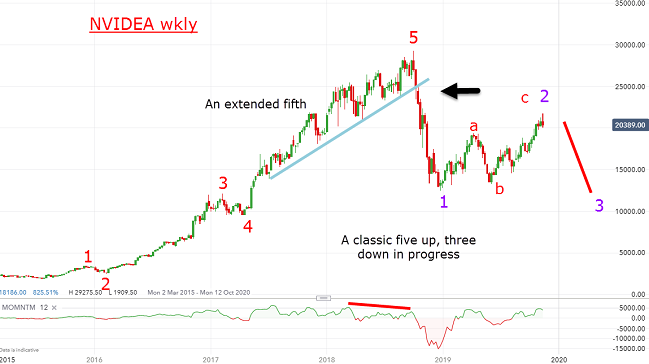
Source: interactive investor Past performance is not a guide to future performance
That $300 top is my fifth wave, and a break of the blue trendline was the signal to sell as the uptrend was clearly in great jeopardy. The solid blue trendline, which has multiple highly accurate touch points stretching over many months, was decisively broken just two weeks following the high. That is a signal no technical analyst should miss!
And off that high, the market plunged to a low of $122 last December – a savage loss of around a Fibonacci 62%. Ouch! But a short seller on the break would have been looking at a profit of at least $100 a share within about two months – a typical swing trade.
But note the form of the decline on this daily chart below – in a clear five waves to a solid momentum divergence as the selling pressure dried up into my fifth wave low. That was another clear signal for any observant technical analyst! Then, expect a reversal – and a sharp one given the strong momentum divergence.
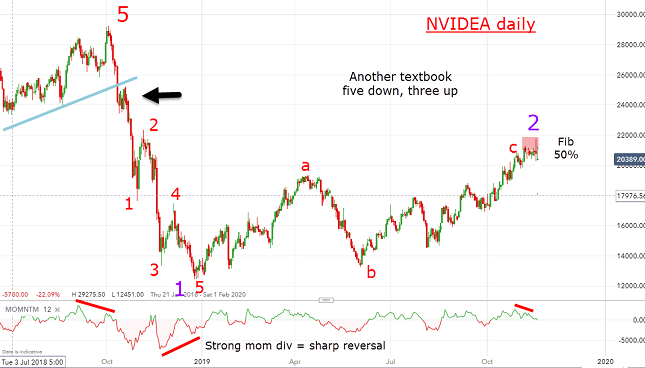
Source: interactive investor Past performance is not a guide to future performance
And the recovery this year shows a three-wave pattern to the recent high around $210, which is a Fibonacci 50% retrace of the entire five-down wave. In addition, I have a small momentum divergence forming on the daily.
My best guess is that the market will start turning lower in a large third wave, although they may advance to the Fibonacci 62% retrace at $225 first. The key to this view is for the market to move sharply lower, with large daily ranges to confirm third wave action. Any strong push above $225 would send me back to the drawing board.
For more information about Tramline Traders, or to take a three-week free trial, go to www.tramlinetraders.com.
John Burford is the author of the definitive text on his trading method, Tramline Trading. He is also a freelance contributor and not a direct employee of interactive investor.
These articles are provided for information purposes only. Occasionally, an opinion about whether to buy or sell a specific investment may be provided by third parties. The content is not intended to be a personal recommendation to buy or sell any financial instrument or product, or to adopt any investment strategy as it is not provided based on an assessment of your investing knowledge and experience, your financial situation or your investment objectives. The value of your investments, and the income derived from them, may go down as well as up. You may not get back all the money that you invest. The investments referred to in this article may not be suitable for all investors, and if in doubt, an investor should seek advice from a qualified investment adviser.
Full performance can be found on the company or index summary page on the interactive investor website. Simply click on the company's or index name highlighted in the article.
Disclosure
We use a combination of fundamental and technical analysis in forming our view as to the valuation and prospects of an investment. Where relevant we have set out those particular matters we think are important in the above article, but further detail can be found here.
Please note that our article on this investment should not be considered to be a regular publication.
Details of all recommendations issued by ii during the previous 12-month period can be found here.
ii adheres to a strict code of conduct. Contributors may hold shares or have other interests in companies included in these portfolios, which could create a conflict of interests. Contributors intending to write about any financial instruments in which they have an interest are required to disclose such interest to ii and in the article itself. ii will at all times consider whether such interest impairs the objectivity of the recommendation.
In addition, individuals involved in the production of investment articles are subject to a personal account dealing restriction, which prevents them from placing a transaction in the specified instrument(s) for a period before and for five working days after such publication. This is to avoid personal interests conflicting with the interests of the recipients of those investment articles.