Chart of the week: Fear of FTSE 100 tumble grows
13th November 2017 12:04
by John Burford from interactive investor
Is the FTSE poised for another tumble?
For the Chart of the Week, I usually try to find shares that appear ready to advance for long-only portfolios. But search as I may, I am coming up empty-handed this week. In fact, odds are now switching to the view that the has started a downturn that should result in lower values for many leading issues in coming months.
I have already pointed to UK bank shares that are already in solid bear markets - and the financial sector is a pivotal one for the economy as well as for many other share values.
Today's economy relies heavily on the dominant financial engineering that low interest rates - engineered by central banks - have encouraged. Given that, I have been on high alert for a turn down in the FTSE 100 index, led by the banks.
In my coverage on 18 September, I asked then:"Is the FTSE breaking down?". The FTSE was trading at the 7,300 area, and this is the chart I showed:
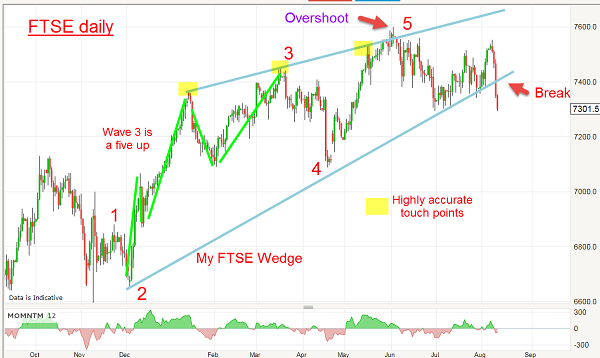
I had a lovely wedge connecting the recent highs and lows and counted five waves to the June high at 7,600 in an 'overshoot'. Remember, overshoots can often foretell a trend reversal when it comes after a lengthy bull (or bear) trend.
And with the break of the lower wedge line, I had my first solid clue that the trend of the market was changing from up to down.
But, as usual, this was not enough for me to conclude the market would shoot straight down. Animal spirits were still running pretty hot. This was the action close-up to 18 September:
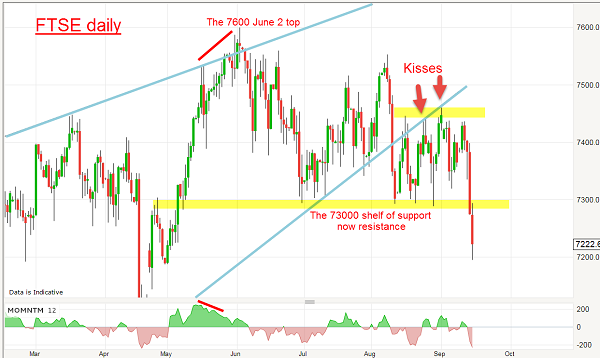
That was very whippy action off the June high and very tricky to trade. But the move off the high was in three waves to date. That allowed the possibility for a rally back towards the lower wedge line in another kiss attempt. Stock indexes usually do not display a 'spike' top. They generally roll over after several scary down/up sequences.
And here is the updated daily chart:
From the 18 September low, the market did indeed rally to attempt another kiss, but the two attempts failed and, crucially, the rally was a clear five-up with a huge momentum divergence at Tuesday's high of 7,582 - an 18-pip miss on the June 7,600 high (which should be an important miss).
But what is the other major UK index - that of higher beta shares - the showing? After all, this is a more UK-focused index than is the FTSE 100, which holds many big overseas commodity and energy operations. The 250 is considered to be a more risk-on index than the relatively stolid 100.
Here is the FTSE 250 daily with chart action this year:
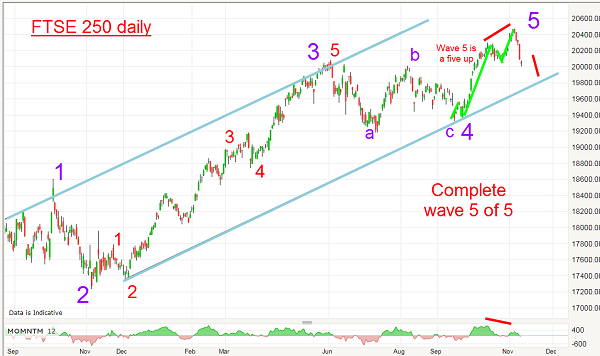
I have a really good trading channel between my blue tramlines and a very clear large scale five-up. Also, the rally off the September low is a clear five-up - just as in the FTSE 100 chart. And there is a huge momentum divergence at the high, which I can now label as the final high.
Chartists will love the upward thrust out of the wedge-shaped purple wave 4 low in wave 5 - these are usually reversed quickly, and this one is conforming to this rule nicely.
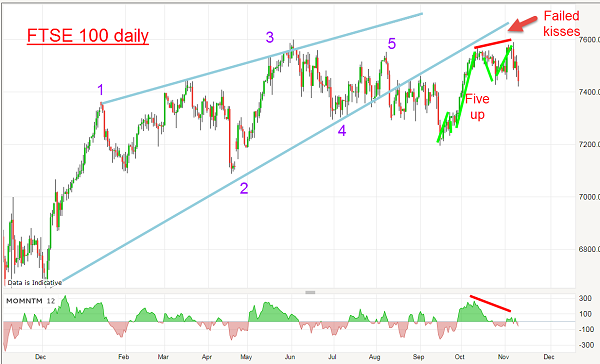
Recall the very long range monthly FTSE 100 chart I showed in September:
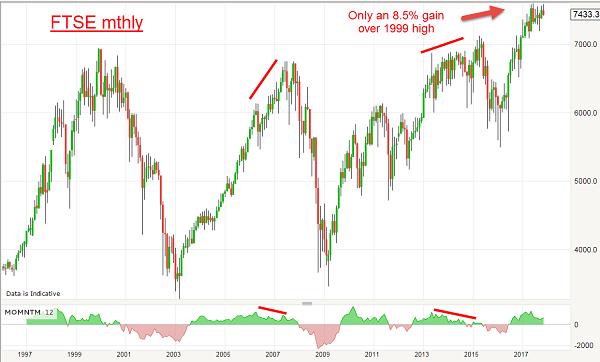
I noted then that the previous all-time high was set back in 1999. In the years of massive QE stimulus, the FTSE has only managed a gain of about 8.4% to the recent 7,600 high. That's a pathetic result compared with the US indexes. It smacks of inherent weakness.
And if we have seen the high, we will have a double top at the 7,600 level between the June and November highs.
The lows on this chart are at the 3,400 area - over 50% less than current levels.
Dare I suggest this becomes a serious target when the downtrend gets underway?
I have a feeling I shall be covering a lot more shares to short in the near-future.
This article is for information and discussion purposes only and does not form a recommendation to invest or otherwise. The value of an investment may fall. The investments referred to in this article may not be suitable for all investors, and if in doubt, an investor should seek advice from a qualified investment adviser.
These articles are provided for information purposes only. Occasionally, an opinion about whether to buy or sell a specific investment may be provided by third parties. The content is not intended to be a personal recommendation to buy or sell any financial instrument or product, or to adopt any investment strategy as it is not provided based on an assessment of your investing knowledge and experience, your financial situation or your investment objectives. The value of your investments, and the income derived from them, may go down as well as up. You may not get back all the money that you invest. The investments referred to in this article may not be suitable for all investors, and if in doubt, an investor should seek advice from a qualified investment adviser.
Full performance can be found on the company or index summary page on the interactive investor website. Simply click on the company's or index name highlighted in the article.
Disclosure
We use a combination of fundamental and technical analysis in forming our view as to the valuation and prospects of an investment. Where relevant we have set out those particular matters we think are important in the above article, but further detail can be found here.
Please note that our article on this investment should not be considered to be a regular publication.
Details of all recommendations issued by ii during the previous 12-month period can be found here.
ii adheres to a strict code of conduct. Contributors may hold shares or have other interests in companies included in these portfolios, which could create a conflict of interests. Contributors intending to write about any financial instruments in which they have an interest are required to disclose such interest to ii and in the article itself. ii will at all times consider whether such interest impairs the objectivity of the recommendation.
In addition, individuals involved in the production of investment articles are subject to a personal account dealing restriction, which prevents them from placing a transaction in the specified instrument(s) for a period before and for five working days after such publication. This is to avoid personal interests conflicting with the interests of the recipients of those investment articles.