Chart of the week: Has the Apple tree finally topped out?
There are good reasons why Apple is worth $1.4trn, but an equally good argument in favour of a fall.
10th February 2020 10:37
by John Burford from interactive investor
There are good reasons why Apple is worth $1.4trn, but an equally good argument in favour of a fall.

Has Apple caught the (financial) virus?
Apple (NASDAQ:AAPL) shares are owned by a great many investors. It is seen as a ‘Set and Forget’ holding. The company dominates the high-end mobile device industry, especially in the West. And its latest quarterly results last month were blockbuster, with the best quarter ever. So why am I proposing a share price fall?
Most individual investors believe great company news is bullish and ‘bad’ news is bearish. That is a natural human first response. But time after time, markets clearly demonstrate that their response must be judged in context. Great news induces a natural confidence in the ability of the market to maintain - or even advance – price levels.
But from experience, that confidence is often misplaced when the good news arrives after a very long share price advance. And Apple has certainly done that! In fact, it has more than doubled in the past year. And in that time, confidence in it has grown massively. Very few believe the share price could suffer a great fall.
Just as no tree grows to the sky, no matter how strong it appears, share prices do reach an upper limit as a cursory examination of any price chart will testify (see Tesla (NASDAQ:TSLA)). So, my question is this: Has the Apple tree topped out?
Here is the long-term performance on the monthly chart showing the incredibly exponential growth since the wave 4 low last year:
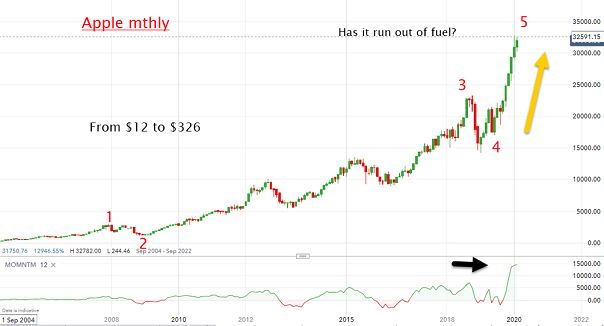
Source: interactive investor Past performance is not a guide to future performance
I have a textbook Elliott wave count and we are currently in the final fifth wave which has been an absolute rocket. Of course, the rocket could extend higher, but what are the shorter-term charts telling us? Here is the daily:
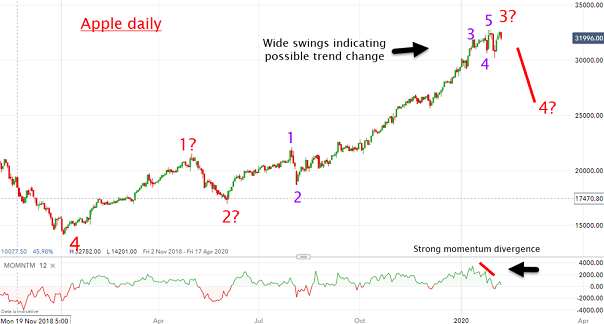
Source: interactive investor Past performance is not a guide to future performance
It is clear the rate of advance has been getting steeper and steeper into the recent $327 high. But that has been met with a significant ramp in volatility that often appears at a trend change. Doubt is creeping in. And note the huge momentum divergence highlighted at the bottom of the chart – also indicating a likely trend change.
The Elliott wave labels on the chart are just one possible interpretation, but either way, a significant decline ahead appears highly likely. With the share price supported by massive stock buybacks (that can be cut at any time), and the effect of the spreading coronavirus, the way is clear for a possible correction to the $235 area in due course.
In terms of stock buybacks, these have been inspired by the ultra-low returns from fixed interest. What better investment for the Apple cash hoard than to invest it in a high-growth company – such as Apple? But with interest rates low and the share price high, has the ‘spread’ reached a limit?
Investors may wish to take evasive action.
For more information about Tramline Traders, or to take a three-week free trial, go to www.tramlinetraders.com.
John Burford is the author of the definitive text on his trading method, Tramline Trading. He is also a freelance contributor and not a direct employee of interactive investor.
These articles are provided for information purposes only. Occasionally, an opinion about whether to buy or sell a specific investment may be provided by third parties. The content is not intended to be a personal recommendation to buy or sell any financial instrument or product, or to adopt any investment strategy as it is not provided based on an assessment of your investing knowledge and experience, your financial situation or your investment objectives. The value of your investments, and the income derived from them, may go down as well as up. You may not get back all the money that you invest. The investments referred to in this article may not be suitable for all investors, and if in doubt, an investor should seek advice from a qualified investment adviser.
Full performance can be found on the company or index summary page on the interactive investor website. Simply click on the company's or index name highlighted in the article.
Disclosure
We use a combination of fundamental and technical analysis in forming our view as to the valuation and prospects of an investment. Where relevant we have set out those particular matters we think are important in the above article, but further detail can be found here.
Please note that our article on this investment should not be considered to be a regular publication.
Details of all recommendations issued by ii during the previous 12-month period can be found here.
ii adheres to a strict code of conduct. Contributors may hold shares or have other interests in companies included in these portfolios, which could create a conflict of interests. Contributors intending to write about any financial instruments in which they have an interest are required to disclose such interest to ii and in the article itself. ii will at all times consider whether such interest impairs the objectivity of the recommendation.
In addition, individuals involved in the production of investment articles are subject to a personal account dealing restriction, which prevents them from placing a transaction in the specified instrument(s) for a period before and for five working days after such publication. This is to avoid personal interests conflicting with the interests of the recipients of those investment articles.