Chart of the week: latest share price forecast for Lloyds Bank
11th April 2022 14:31
by John Burford from interactive investor
Higher interest rates are meant to be good news for UK-focused banks, but what does the future hold for Lloyds? After checking the charts, technical analyst John Burford gives his opinion.

Lloyds Bank recovers to move higher
The banking sector has been taking something of a hammering lately as the world watches in a mixture of amazement and horror at the carnage being exacted in the Ukraine conflict and bond markets.
US Treasuries are in the largest and longest slump seen for many years with the benchmark 10-years yielding 2.8% - a new high. Only three months ago, the yield was 1.2% and lower.
UK gilts have also fallen sharply with mortgage rates moving higher. Normally, this would be of benefit to the banking sector as the higher rates imply that gross margins improve. When rates were super low, margins were being squeezed.
- Are Lloyds Bank shares ready to grow?
- Insider: four UK shares the bosses think are going cheap
- FTSE 100 winners and losers in a turbulent first quarter
The big question now is this: will bond yields move even higher in the short to medium term and will housing demand tail off, with mortgage approvals set to fall with negative implications for banking profits?
- Invest with ii: Top UK Shares | Share Tips & Ideas | Open a Trading Account
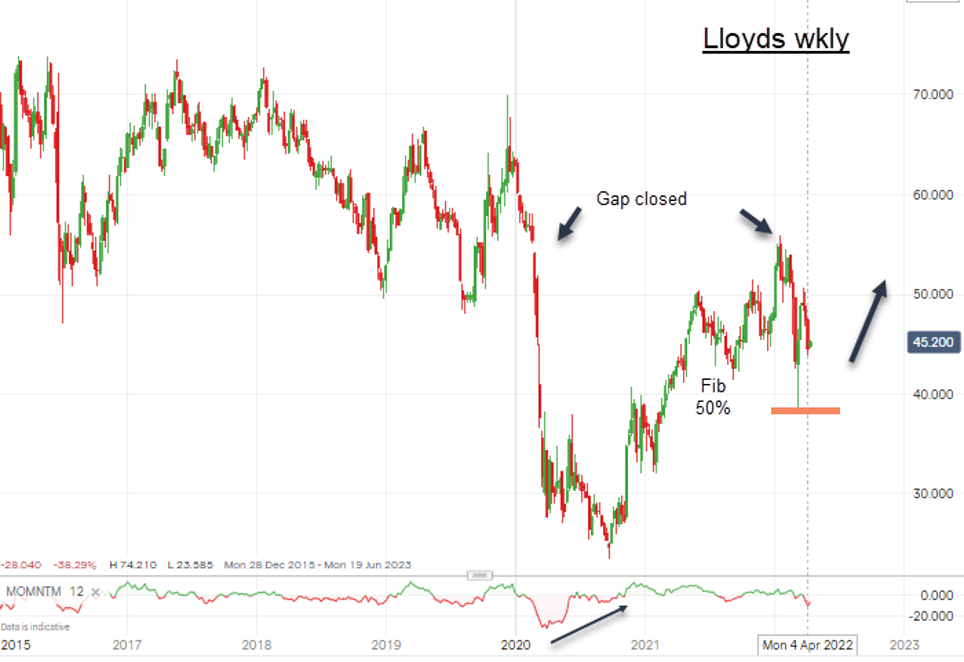
Turning to Lloyds Banking Group (LSE:LLOY) – our most domestic-facing high street bank – the shares appear to be at a crossroads and, with sentiment largely bearish, they appear poised to move higher.
About a month ago, the shares fell hard to the 38p low on fears the Ukraine conflict would hurt the banks, as Russia sanctions were being imposed and retaliation was seen as likely, with visions of a nuclear World War III widespread.
But those worries were overblown (as they usually are when a war suddenly starts) and the shares are recovering.

Past performance is not a guide to future performance.
Note that the rally off the corona crash lows in 2000 (heralded by the large momentum divergence as shown) moved up to fill the important gap formed as the corona crash was getting under way. The shares then fell back, as is usual when a gap is filled.
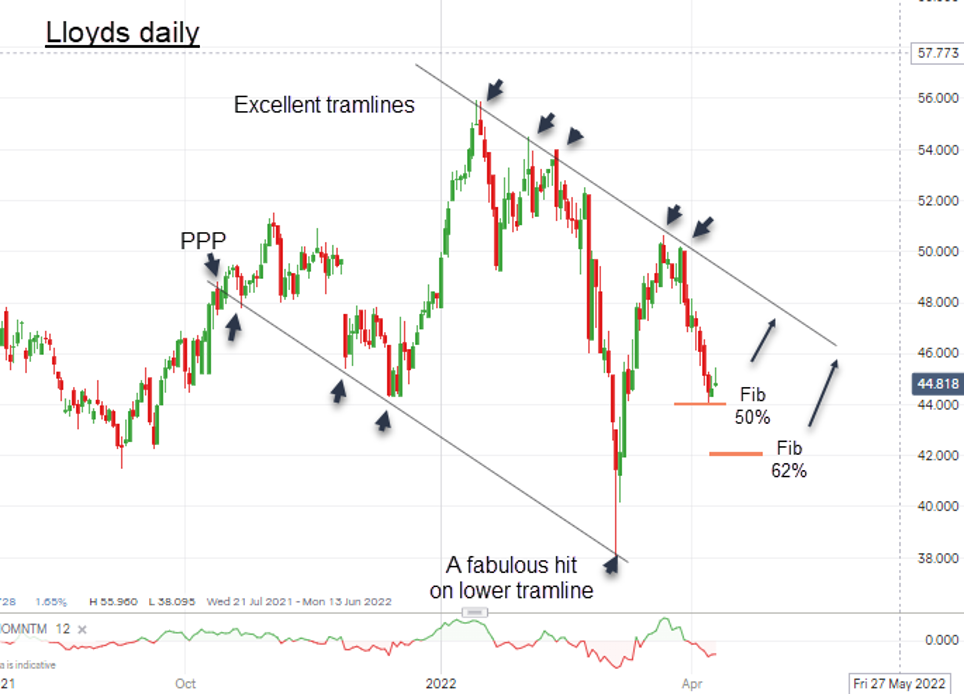
And here is the latest action on the daily chart:

Past performance is not a guide to future performance.
First, note the excellent tramlines with very accurate touch points – especially the last one on the lower line. That makes it a very secure line of support. And drawing the parallel line off the three highest points and extending it lower touches the latest rally in two more places. That makes that line an excellent line of resistance.
So, any move up to that line from the current 45p to around the 48p region would set up a big test of that resistance. Of course, breaking above it would be highly significant and would point to higher prices, with first target at the old 56p high.
John Burford is a freelance contributor and not a direct employee of interactive investor.
These articles are provided for information purposes only. Occasionally, an opinion about whether to buy or sell a specific investment may be provided by third parties. The content is not intended to be a personal recommendation to buy or sell any financial instrument or product, or to adopt any investment strategy as it is not provided based on an assessment of your investing knowledge and experience, your financial situation or your investment objectives. The value of your investments, and the income derived from them, may go down as well as up. You may not get back all the money that you invest. The investments referred to in this article may not be suitable for all investors, and if in doubt, an investor should seek advice from a qualified investment adviser.
Full performance can be found on the company or index summary page on the interactive investor website. Simply click on the company's or index name highlighted in the article.
Disclosure
We use a combination of fundamental and technical analysis in forming our view as to the valuation and prospects of an investment. Where relevant we have set out those particular matters we think are important in the above article, but further detail can be found here.
Please note that our article on this investment should not be considered to be a regular publication.
Details of all recommendations issued by ii during the previous 12-month period can be found here.
ii adheres to a strict code of conduct. Contributors may hold shares or have other interests in companies included in these portfolios, which could create a conflict of interests. Contributors intending to write about any financial instruments in which they have an interest are required to disclose such interest to ii and in the article itself. ii will at all times consider whether such interest impairs the objectivity of the recommendation.
In addition, individuals involved in the production of investment articles are subject to a personal account dealing restriction, which prevents them from placing a transaction in the specified instrument(s) for a period before and for five working days after such publication. This is to avoid personal interests conflicting with the interests of the recipients of those investment articles.