Chart of the week: A low risk/high probability trade
28th August 2018 11:49
by John Burford from interactive investor
It's down sharply from its 2016 peak, but technical analyst John Burford thinks this share is starting to look very interesting.

Randgold is back on the launch pad
Gold miners have had a terrible press in recent months – and no wonder, the gold price has been in a state of near-collapse. This, while US share indices have been rocketing and thus removing the 'safe haven' rationale for buying precious metals, which is conventionally (and totally erroneously) given to the precious metals.
In fact, when you look at the historical record, when stocks are in a bear trend, gold usually follows along (as does silver). That is because the demand for assets declines as does the price when the mood turns negative. Even an authority no less worthy than the CME Group recently issued an erudite piece headed: Has Gold Lost Its Safe-Haven Status?
• An ideal setup for a short squeeze
• Scene set for 'mammoth' rally phase at this blue chip
Think of this: If gold is such a safe haven in times of economic turmoil, why are natives of Venezuela not clamouring for gold, rather than dollars just to buy food? A gold sovereign in your pocket in that country would find few people to exchange with, although a bank might give you a sackful of Bolivars. Lucky you!
The bearish case against an imminent gold rally rests on the widespread belief that since no economist expects a US recession any time soon, gold should continue on its downward path as it loses its 'safe-haven' status. Hmm. And we know how most market predictions of the economists have fared when compared with actual experience, don't we?
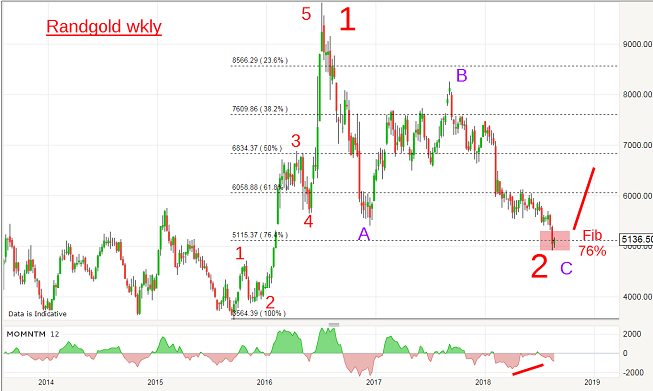
So, with sentiment against gold miners so negative, what do the charts say? Do they back up this uber-bearish thesis? Here is the weekly Randgold Resources Ltd chart covering the last five years:

Source: interactive investor Past performance is not a guide to future performance
Early in 2016, as the gold price improved, Randgold shares took off, rising from the £30 area to a high of £98 in July 2016. And it did it in five clear Elliott waves. That was a textbook move, especially as it sported an extended fifth wave that is entirely typical in natural resource shares.
That is because at the end of a strong bull run in a commodity, panicky thoughts of scarcity are running amok.
And from that high, the market declined in classic three large waves A-B-C where the C wave at the current £50 level appears to have completed - and bang on the Fibonacci 76% retrace and with a strong momentum divergence to boot. This is starting to look very interesting.
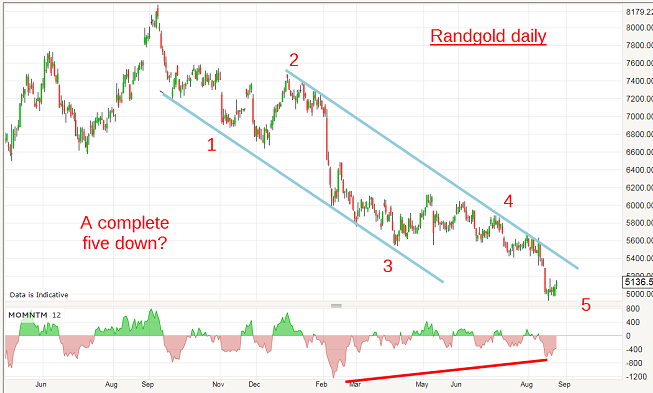
For added clues, I will go to the daily chart:

Source: interactive investor Past performance is not a guide to future performance
The latest decline is also in a five down and on a strong momentum divergence.
To my mind, we have a low risk/high probability trade here – and in the classic Buy Low/Sell High category.
Many cautious investors would say: "Never try to catch a falling knife!" I say:
"When the evidence stacks up for a major turn, getting in early is smart. If wrong, we have a good stop loss strategy to limit the loss. If correct, we can brag to our amazed friends about how we bought at the low."
If this is correct, I expect a push up past the upper 'tramline' in short order and then on to my first target in the £60 region. After that, I have much higher targets.
So, let's see if gold has truly lost its 'safe-haven' status or has taken on another.
John Burford is the author of the definitive text on his trading method, Tramline Trading. He is also a freelance contributor and not a direct employee of interactive investor.
These articles are provided for information purposes only. Occasionally, an opinion about whether to buy or sell a specific investment may be provided by third parties. The content is not intended to be a personal recommendation to buy or sell any financial instrument or product, or to adopt any investment strategy as it is not provided based on an assessment of your investing knowledge and experience, your financial situation or your investment objectives. The value of your investments, and the income derived from them, may go down as well as up. You may not get back all the money that you invest. The investments referred to in this article may not be suitable for all investors, and if in doubt, an investor should seek advice from a qualified investment adviser.
Full performance can be found on the company or index summary page on the interactive investor website. Simply click on the company's or index name highlighted in the article.
Disclosure
We use a combination of fundamental and technical analysis in forming our view as to the valuation and prospects of an investment. Where relevant we have set out those particular matters we think are important in the above article, but further detail can be found here.
Please note that our article on this investment should not be considered to be a regular publication.
Details of all recommendations issued by ii during the previous 12-month period can be found here.
ii adheres to a strict code of conduct. Contributors may hold shares or have other interests in companies included in these portfolios, which could create a conflict of interests. Contributors intending to write about any financial instruments in which they have an interest are required to disclose such interest to ii and in the article itself. ii will at all times consider whether such interest impairs the objectivity of the recommendation.
In addition, individuals involved in the production of investment articles are subject to a personal account dealing restriction, which prevents them from placing a transaction in the specified instrument(s) for a period before and for five working days after such publication. This is to avoid personal interests conflicting with the interests of the recipients of those investment articles.