Chart of the week: A low risk/high probability trade
Recent price action suggests this ex-10-bagger could enjoy a sharp rally, argues our technical analyst.
25th February 2019 10:40
by John Burford from interactive investor
Recent price action suggests this ex-10-bagger could enjoy a sharp rally, argues our technical analyst.

Is Liberty Global now a solid Buy?
This global TV and broadband company (incorporating Virgin Media among others) was another darling of the Stock Exchange – until June 2015, that is. Since then, it has disappointed early investors by shedding a Fibonacci 62% from its £58 high to the recent $20 low last month.
Was that $20 low a Fibonacci coincidence (hint: not if you have been following my Tramline Trading methods here).
So, with that drop, is this on my list of 'Buy Low/Sell High' candidates?
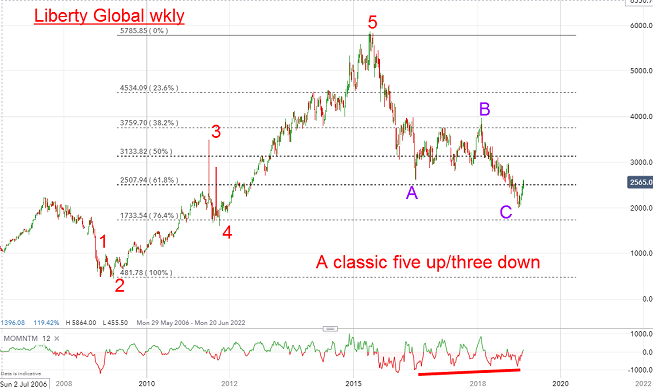
Let's have a look at the long range weekly chart for perspective and clues:
Source: interactive investor Past performance is not a guide to future performance
From the March 2009 Credit Crunch lows at around $5, the rally has traced out a classic five up to the 2015 high at $58 – a 10-bagger. No wonder retail investors flocked to this share!
But in a timeless proof of the maxim that knowing when to sell an investment is a heck of a lot harder than pushing the Buy button, the shares embarked on the 3½-year bear trend after breaking key support levels.
Not that knowing when to buy is simple! Far from it – but by using a time-tested method, your odds of success are much greater than buying at random (otherwise known as the 'gut feel' method). Correct timing is crucial. Also with a proven method to enable entering near major turns, you can set your stop loss quite close to entry and that offers you a low risk/high probability trade.
And I believe we are being presented with just that here.
The decline is a classic 'three down' to a momentum divergence around the Fibonacci 62% level (that level should ring a bell!). That places the odds for a significant rally phase front and centre.
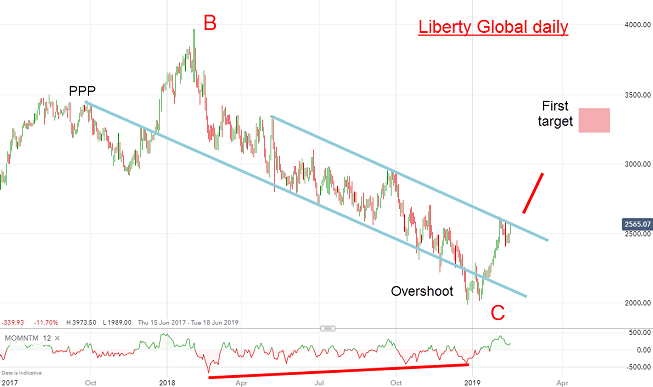
Here is the daily chart of the latest action in the C wave:
Source: interactive investor Past performance is not a guide to future performance
I have a lovely tramline pair with the lower line of particular interest. First, I have a highly accurate PPP (Prior Pivot Point).
Second, there is a superb 'overshoot' (a selling climax) at the wave C low. An overshoot of a reliable tramline usually heralds a sharp reversal - and that is indeed what is in progress.
The market is testing the upper tramline and my first target is the $32-$34 zone. An eventual break above the B wave high at $40 would set up higher targets where $44 would not be out of the question.
Naturally, only a solid move below the $20 low would cause me to re-assess.
John Burford is the author of the definitive text on his trading method, Tramline Trading. He is also a freelance contributor and not a direct employee of interactive investor.
These articles are provided for information purposes only. Occasionally, an opinion about whether to buy or sell a specific investment may be provided by third parties. The content is not intended to be a personal recommendation to buy or sell any financial instrument or product, or to adopt any investment strategy as it is not provided based on an assessment of your investing knowledge and experience, your financial situation or your investment objectives. The value of your investments, and the income derived from them, may go down as well as up. You may not get back all the money that you invest. The investments referred to in this article may not be suitable for all investors, and if in doubt, an investor should seek advice from a qualified investment adviser.
Full performance can be found on the company or index summary page on the interactive investor website. Simply click on the company's or index name highlighted in the article.
Disclosure
We use a combination of fundamental and technical analysis in forming our view as to the valuation and prospects of an investment. Where relevant we have set out those particular matters we think are important in the above article, but further detail can be found here.
Please note that our article on this investment should not be considered to be a regular publication.
Details of all recommendations issued by ii during the previous 12-month period can be found here.
ii adheres to a strict code of conduct. Contributors may hold shares or have other interests in companies included in these portfolios, which could create a conflict of interests. Contributors intending to write about any financial instruments in which they have an interest are required to disclose such interest to ii and in the article itself. ii will at all times consider whether such interest impairs the objectivity of the recommendation.
In addition, individuals involved in the production of investment articles are subject to a personal account dealing restriction, which prevents them from placing a transaction in the specified instrument(s) for a period before and for five working days after such publication. This is to avoid personal interests conflicting with the interests of the recipients of those investment articles.