Chart of the week: A medical advantage to this stock
A new trend endorsed by rappers and the NHS could have positive implications for this share.
11th November 2019 11:59
by John Burford from interactive investor
A new trend endorsed by rappers and the NHS could have positive implications for this share.

Canopy Growth (TSE:WEED), largest of the 'pot stocks', started life in a wave of bullish enthusiasm for the sector's prospects last year. It opened trading at $25, surged to $60 and since then, has been buffeted by the growing negative outlook for profits. It is currently trading under its IPO price. But is it setting up a classic Buy Low/Sell High opportunity?
There is no doubt the tide is turning. Acceptance of the formerly 'evil weed' is mounting as its medicinal advantages are slowly being recognised with heavy public pressure being applied to the authorities. And government-controlled recreational use likewise is on the rise, albeit as a means for Western governments to replace their dwindling tobacco revenues.
The key to a further growth surge in the industry is the attitude of the US Federal government. Many individual states have legalised but the Feds remain opposed. Unlocking that door and pot stocks will surge. Most analysts advise investors to not hold their breath on that one, but could they be wrong with juicy tax and duty revenues beckoning?
With the price chart being only a few months old, I am not able to offer a deep analysis of it, but early indications are that we may have reached a low last month.
On Friday, the company announced a link-up with the celebrity named Drake - who I confess I have not heard of (but then, I am in the wrong generation) – to promote a new brand. The shares jumped by 10% on the news. However, they have tried celebrity link-ups before with little success. But could this time be different?
Here is the daily:
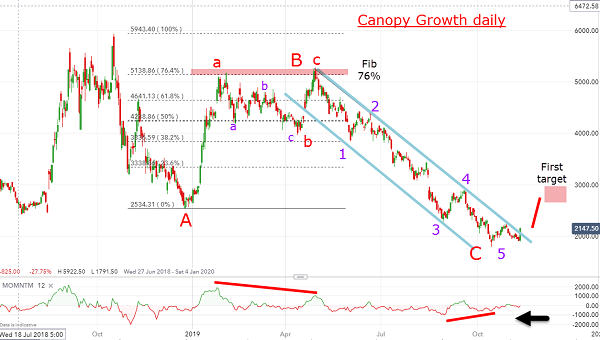
Source: interactive investor Past performance is not a guide to future performance
The shares have indeed been in a rollercoaster, but these Elliott wave labels are my best shot at setting the scene. Note the lovely bearish momentum divergence into the red B wave high at $50 in April - right on the Fibonacci 76% retrace of the red A wave. Then the slide down the staircase within my tramlines in five clear waves to complete wave 5 at the C wave $18 low last Monday that also sports a clear bullish momentum divergence.
And the Drake news on Friday helped push the market above my upper tramline in what should be the start of a bull phase with my first target around the $20 region with higher potential thereafter. With short interest still very high, I believe odds strongly favour further advances.
And if the US Feds do act to legalise – or we see rumours to that effect – I can see a surge to the $40 area pretty rapidly. In any case, the downside appears to be limited, but a move below the $18 low would require a move back to the drawing board.
Monday Flash: The NHS has just announced it is approving some cannabis drugs for the first time and is opening the door for further approvals. This trend can only grow.
For more information about Tramline Traders, or to take a three-week free trial, go to www.tramlinetraders.com.
John Burford is the author of the definitive text on his trading method, Tramline Trading. He is also a freelance contributor and not a direct employee of interactive investor.
These articles are provided for information purposes only. Occasionally, an opinion about whether to buy or sell a specific investment may be provided by third parties. The content is not intended to be a personal recommendation to buy or sell any financial instrument or product, or to adopt any investment strategy as it is not provided based on an assessment of your investing knowledge and experience, your financial situation or your investment objectives. The value of your investments, and the income derived from them, may go down as well as up. You may not get back all the money that you invest. The investments referred to in this article may not be suitable for all investors, and if in doubt, an investor should seek advice from a qualified investment adviser.
Full performance can be found on the company or index summary page on the interactive investor website. Simply click on the company's or index name highlighted in the article.
Disclosure
We use a combination of fundamental and technical analysis in forming our view as to the valuation and prospects of an investment. Where relevant we have set out those particular matters we think are important in the above article, but further detail can be found here.
Please note that our article on this investment should not be considered to be a regular publication.
Details of all recommendations issued by ii during the previous 12-month period can be found here.
ii adheres to a strict code of conduct. Contributors may hold shares or have other interests in companies included in these portfolios, which could create a conflict of interests. Contributors intending to write about any financial instruments in which they have an interest are required to disclose such interest to ii and in the article itself. ii will at all times consider whether such interest impairs the objectivity of the recommendation.
In addition, individuals involved in the production of investment articles are subject to a personal account dealing restriction, which prevents them from placing a transaction in the specified instrument(s) for a period before and for five working days after such publication. This is to avoid personal interests conflicting with the interests of the recipients of those investment articles.