Chart of the week: A simple trade with high probability
This UK stock trade is going to plan, and this easy trading method has spotted another opportunity.
28th May 2019 11:27
by John Burford from interactive investor
This UK stock trade is going to plan, and this easy trading method has spotted another opportunity.

BAT follows my roadmap
British American Tobacco (LSE:BATS) is the classic defensive share with a hefty dividend yield of over 8% in the last financial year which has zoomed up from the 4% zone prevailing in previous years.
In my latest coverage of BAT on 1 April, I noted that the rally off the January low at £23.50 very likely marked a major trend reversal. Previously, the shares were in a solid downtrend off the June 2017 high at £56.
The move down off that high was prompted by the news that the US Food and Drug Administration wants to ban menthol cigarettes, which represents a big chunk of BAT's output.
And in my original coverage on 28 January I laid out my case that the low would likely hold and kick off a hefty rally phase. I based my analysis on the chart patterns and also on a reading of market sentiment, which was bearish.
Crucially, I was able to draw in a terrific tramline pair that observed all the rules. And here is the chart posted in April:
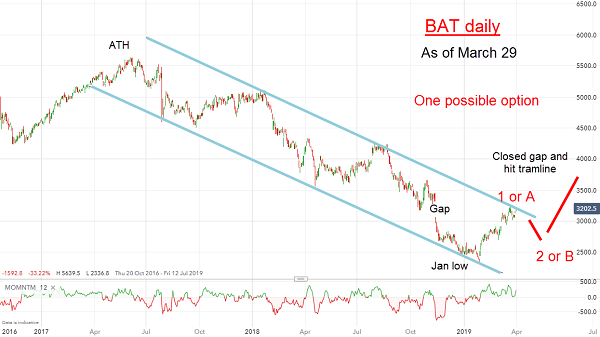
Source: interactive investor Past performance is not a guide to future performance
The rally had carried back to the upper tramline, which is where I expected a pull-back off resistance in a second wave. As you can see, that was the low and the new uptrend went on to close the gap as I suggested.
Incidentally, my bullish call flies in the face of the lazy plaint of most pundits who claim it is impossible to pick tops and bottoms, so you shouldn’t even try. But imagine if there is some simple method that can do that with high probability. Isn’t that something that would be of interest to open-minded traders/investors?
This is what I wrote in April:
So we have met a target – where to now? Having closed the gap and hit resistance, my most likely scenario is for a correction in wave 2 or B and then a fresh advance to break above the upper tramline. If that occurs, my next target cited last time would be £34 and then possibly £40 - £42.
So here is the latest action since last time:
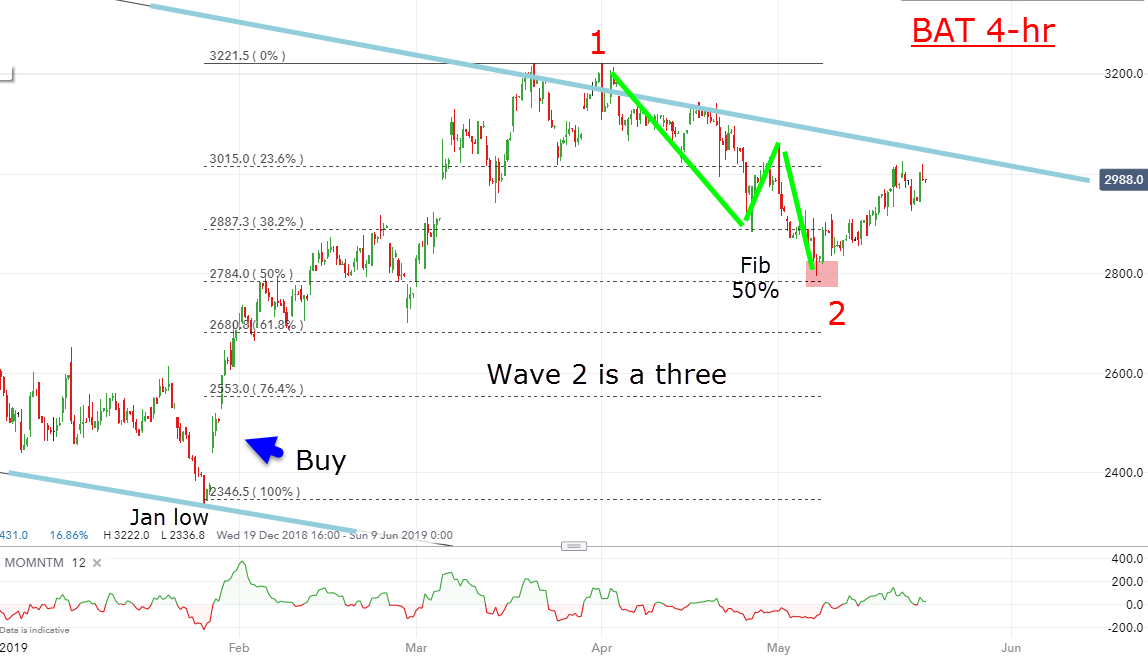
Source: interactive investor Past performance is not a guide to future performance
My forecast pull-back occurred bang on cue and is in my wished-for three waves. Remember, three waves are always corrective to the main trend. And it carried right to the Fibonacci 50% retrace at the £28 region, which represented a great buying opportunity.
So now the test is on. I am looking for a clear push above the upper tramline in the £31 region to confirm the new uptrend. My upper targets remain in play.
For more information about Tramline Traders, or to take a three-week free trial, go to www.tramlinetraders.com.
John Burford is the author of the definitive text on his trading method, Tramline Trading. He is also a freelance contributor and not a direct employee of interactive investor.
These articles are provided for information purposes only. Occasionally, an opinion about whether to buy or sell a specific investment may be provided by third parties. The content is not intended to be a personal recommendation to buy or sell any financial instrument or product, or to adopt any investment strategy as it is not provided based on an assessment of your investing knowledge and experience, your financial situation or your investment objectives. The value of your investments, and the income derived from them, may go down as well as up. You may not get back all the money that you invest. The investments referred to in this article may not be suitable for all investors, and if in doubt, an investor should seek advice from a qualified investment adviser.
Full performance can be found on the company or index summary page on the interactive investor website. Simply click on the company's or index name highlighted in the article.
Disclosure
We use a combination of fundamental and technical analysis in forming our view as to the valuation and prospects of an investment. Where relevant we have set out those particular matters we think are important in the above article, but further detail can be found here.
Please note that our article on this investment should not be considered to be a regular publication.
Details of all recommendations issued by ii during the previous 12-month period can be found here.
ii adheres to a strict code of conduct. Contributors may hold shares or have other interests in companies included in these portfolios, which could create a conflict of interests. Contributors intending to write about any financial instruments in which they have an interest are required to disclose such interest to ii and in the article itself. ii will at all times consider whether such interest impairs the objectivity of the recommendation.
In addition, individuals involved in the production of investment articles are subject to a personal account dealing restriction, which prevents them from placing a transaction in the specified instrument(s) for a period before and for five working days after such publication. This is to avoid personal interests conflicting with the interests of the recipients of those investment articles.