Chart of the week: This winning trade could deliver again
This trade, highlighted here in January, made a 35% profit. Our chartist tells us how to play it next.
1st April 2019 11:04
by John Burford from interactive investor
This trade, highlighted here in January, made a 35% profit. Our chartist tells us how to play it next.

I went to bat for BAT – and hit a six!
In my Chart of the week column of January 28, I laid out my case that British American Tobacco (LSE:BATS) would start a large counter-trend rally phase off the horrendous bear trend that had been in force off the June 2017 high at £56.
In fact, I gave four solid technical reasons why the shares would likely reverse off the £23 low made on 28 January and set my first target at the closing of the previous gap around the £32 area. That target was reached precisely on 20 March before peeling away. Nice.
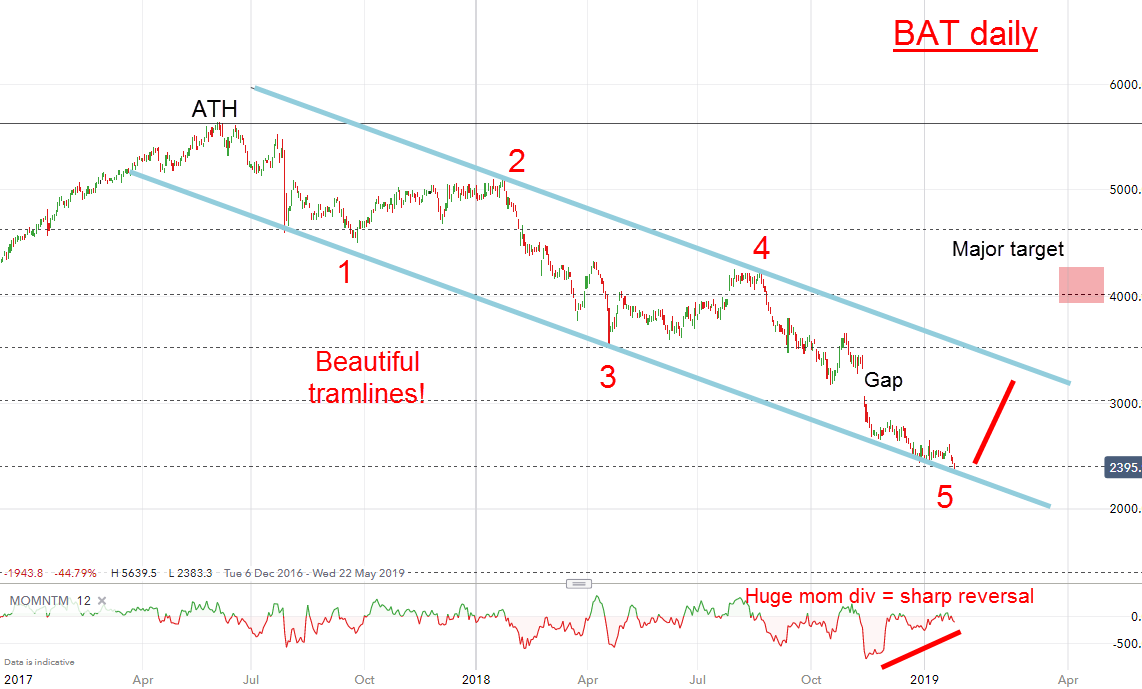
To recap: this was the daily chart I showed as of January 28 that held out that promise:

Source: interactive investor Past performance is not a guide to future performance
In late January, we had a potentially complete five waves down (remember, the fifth wave is an ending wave) with the decline travelling in the channel between my tramlines. The killer feature was the huge momentum divergence at the low. This is always a warning to expect a high-probability strong reversal.
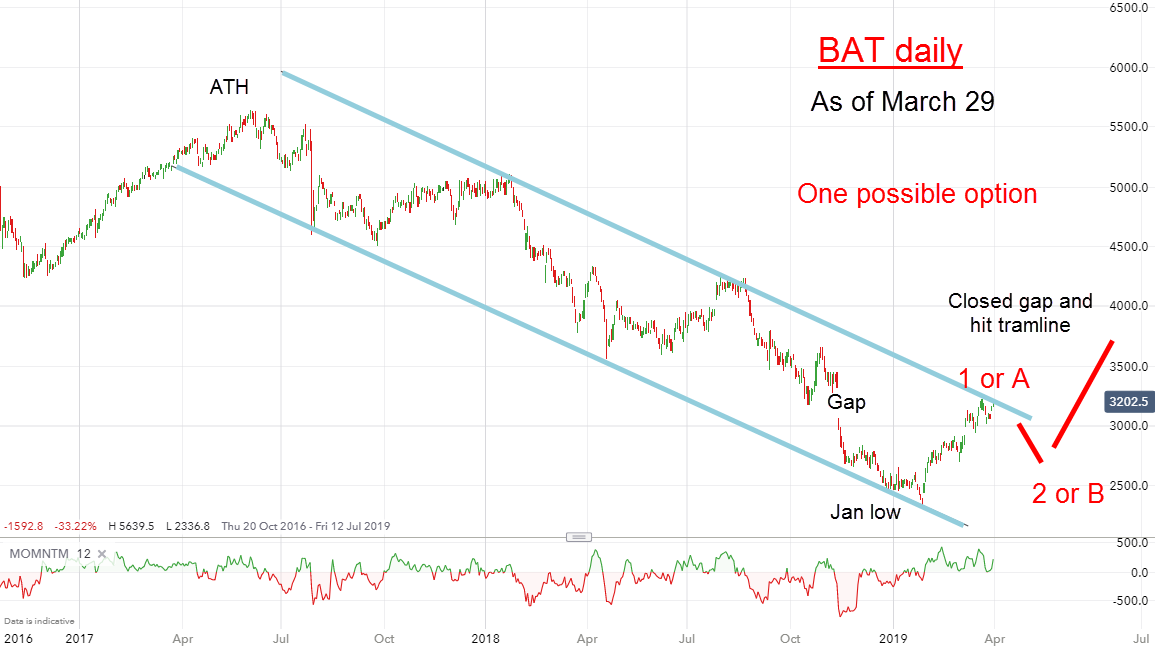
And so it came to pass. Since then, we have seen a strong advance to the recent £32 high and here is the chart updated:

Source: interactive investor Past performance is not a guide to future performance
The gap is now closed (gaps act as magnets) and the upper tramline resistance met. My first target hit.
As far as I know, there have been no major company developments that could 'explain' the reversal at the time it made the £23 low. Most 'conventional' analysts would have no explanation for this 'sudden' reversal other to say the shares were 'oversold' and due for a re-rating.
OK, so why did it occur when it did? Surely, the very same rationale could have been applied in August when the shares were trading much higher at £40 (oversold then), or in October when they were at £35 (also oversold then). They would have been way too early. No, that is post-event rationalisation and totally arbitrary.
The great benefit of using my Tramline Trading method is that it gives logical forecasts of likely events before they occur, not post-event rationalisations.
So, we have met a target – where to now?
Having closed the gap and hit resistance, my most likely scenario is for a correction in wave 2 or B and then a fresh advance to break above the upper tramline. If that occurs, my next target, cited last time, would be £34 and then possibly £40-£42.
And because the momentum divergence at the January low was so large, odds favour further advances. But as a swing trader, I am taking some profits off the table here and looking to reinstate if and when we get a dip. But if the uptrend continues, I am happy to sit with my position – there is always a dip coming!
For more information about Tramline Traders, or to take a three-week free trial, go to www.tramlinetraders.com.
John Burford is the author of the definitive text on his trading method, Tramline Trading. He is also a freelance contributor and not a direct employee of interactive investor.
These articles are provided for information purposes only. Occasionally, an opinion about whether to buy or sell a specific investment may be provided by third parties. The content is not intended to be a personal recommendation to buy or sell any financial instrument or product, or to adopt any investment strategy as it is not provided based on an assessment of your investing knowledge and experience, your financial situation or your investment objectives. The value of your investments, and the income derived from them, may go down as well as up. You may not get back all the money that you invest. The investments referred to in this article may not be suitable for all investors, and if in doubt, an investor should seek advice from a qualified investment adviser.
Full performance can be found on the company or index summary page on the interactive investor website. Simply click on the company's or index name highlighted in the article.
Disclosure
We use a combination of fundamental and technical analysis in forming our view as to the valuation and prospects of an investment. Where relevant we have set out those particular matters we think are important in the above article, but further detail can be found here.
Please note that our article on this investment should not be considered to be a regular publication.
Details of all recommendations issued by ii during the previous 12-month period can be found here.
ii adheres to a strict code of conduct. Contributors may hold shares or have other interests in companies included in these portfolios, which could create a conflict of interests. Contributors intending to write about any financial instruments in which they have an interest are required to disclose such interest to ii and in the article itself. ii will at all times consider whether such interest impairs the objectivity of the recommendation.
In addition, individuals involved in the production of investment articles are subject to a personal account dealing restriction, which prevents them from placing a transaction in the specified instrument(s) for a period before and for five working days after such publication. This is to avoid personal interests conflicting with the interests of the recipients of those investment articles.