Chart of the week: Stocks versus Cash
Successful analyst John Burford goes against consensus with this market call.
3rd February 2020 11:28
by John Burford from interactive investor
Successful analyst John Burford goes against consensus with this market call.

Is the FTSE headed much lower post-Brexit Day?
Today I cover the FTSE 100 index – a fairly rare event for me as I have not been confident about identifying the wave structure off the August 2019 low. But now I am – and I am maximum bearish.
In fact, in my recent Chart of the week of December 23 as I reviewed the FTSE charts, this is what I wrote: I expect a bear market in 2020. That was no sit-on-the-fence ‘will it, won’t it’ that permeates so much market analysis. And it flew in the face of many pundits’ claims that the ‘Boris Bounce’ would ensure smooth sailing for the UK economy after Brexit as the floodgates of delayed investments are suddenly flung open.
I believed then that this optimism was greatly misplaced and that the Boris Honeymoon would be a brief one, leading to a return of some Tory divisions of old.
Mine is not a political piece, but now we are seeing cracks in the wall from the HS2 fiasco, Huawei 5G hit to BT shareholders, and now the Chinese virus scares that have come out of left field. Not to mention the likely tortured and acrimonious UK–EU trade negotiations that will take up much of this year – if not longer.
But was my timing correct at Christmas for the start of the bear trend?
Here is the chart I showed in December:
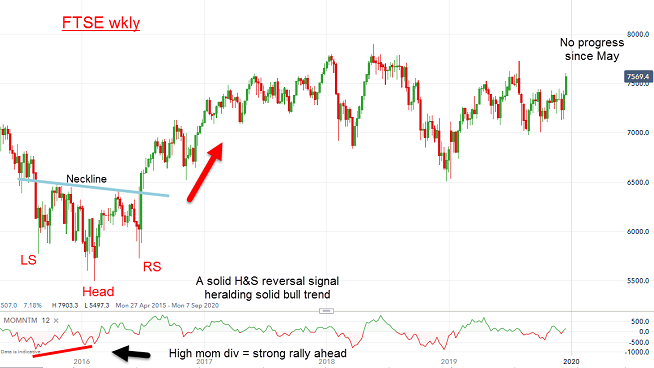
Source: interactive investor Past performance is not a guide to future performance
Pretty complex waves, no? But I was not distraught that I had failed to see a clear wave picture that would provide my roadmap for 2020 – until then. But last month, the fog was definitely clearing, and I suspected major highs were very close.
And this is the current picture:
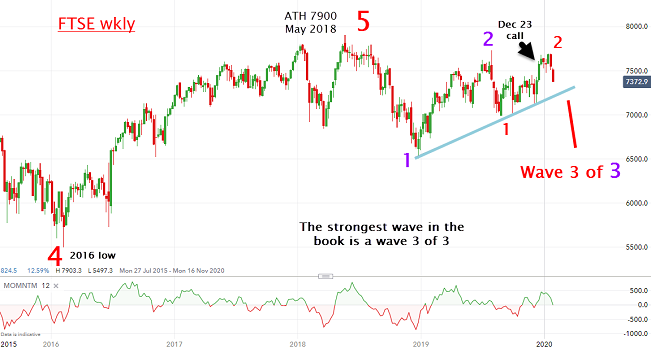
Source: interactive investor Past performance is not a guide to future performance
With last week’s reversal (which occurred below both the all-time high (ATH) at 7,900 in August 2018 and the purple wave 2 high last July), I can now claim the above wave labelling is the odds-on favourite. We are in a strong wave lower. And note the December timing – just one more small advance to the 7,700 high of Monday 20 January and then straight down.
So, we are likely starting a third of a third wave down. The key confirmation would be a hard break of the blue trendline at around 7,200 that was tested on Friday. Remember, this type of wave tends to be devastating in scope. It is often a ‘blink and you miss it’ move.
And a break of the purple wave 1 at 6,500 would certainly induce worry lines in the Brexit bulls.
The bottom line: This may be a great time to consider raising cash.
For more information about Tramline Traders, or to take a three-week free trial, go to www.tramlinetraders.com.
John Burford is the author of the definitive text on his trading method, Tramline Trading. He is also a freelance contributor and not a direct employee of interactive investor.
These articles are provided for information purposes only. Occasionally, an opinion about whether to buy or sell a specific investment may be provided by third parties. The content is not intended to be a personal recommendation to buy or sell any financial instrument or product, or to adopt any investment strategy as it is not provided based on an assessment of your investing knowledge and experience, your financial situation or your investment objectives. The value of your investments, and the income derived from them, may go down as well as up. You may not get back all the money that you invest. The investments referred to in this article may not be suitable for all investors, and if in doubt, an investor should seek advice from a qualified investment adviser.
Full performance can be found on the company or index summary page on the interactive investor website. Simply click on the company's or index name highlighted in the article.
Disclosure
We use a combination of fundamental and technical analysis in forming our view as to the valuation and prospects of an investment. Where relevant we have set out those particular matters we think are important in the above article, but further detail can be found here.
Please note that our article on this investment should not be considered to be a regular publication.
Details of all recommendations issued by ii during the previous 12-month period can be found here.
ii adheres to a strict code of conduct. Contributors may hold shares or have other interests in companies included in these portfolios, which could create a conflict of interests. Contributors intending to write about any financial instruments in which they have an interest are required to disclose such interest to ii and in the article itself. ii will at all times consider whether such interest impairs the objectivity of the recommendation.
In addition, individuals involved in the production of investment articles are subject to a personal account dealing restriction, which prevents them from placing a transaction in the specified instrument(s) for a period before and for five working days after such publication. This is to avoid personal interests conflicting with the interests of the recipients of those investment articles.