Chart of the week: tech stocks and what to make of the crash
24th January 2022 09:43
by John Burford from interactive investor
With the US tech sector in correction territory, experienced analyst John Burford updates his view on the major stocks and what the future might hold.

It seems the FAANGs really are losing their teeth
In my COTW of 10 January, I asked the question: Are the FAANGs losing their teeth? The charts were telling me in no uncertain terms that the great bull market was at least pausing, if not terminating entirely.
- Chart of the week: time to take profits on these trades?
- ii view: Netflix shares plunge after Q4 results
In addition, I had been laying my case since September that taking profits in Apple (NASDAQ:AAPL) was a prudent move since I was seeing signs the rally in the shares was flagging.
In the case of Netflix (NASDAQ:NFLX), this was extremely timely advice as the shares have plunged from its November all-time high at $700 to last week's $380 print -a whopping loss of 45% in only eight weeks.
This was the chart on US Fang Index I posted two weeks ago:
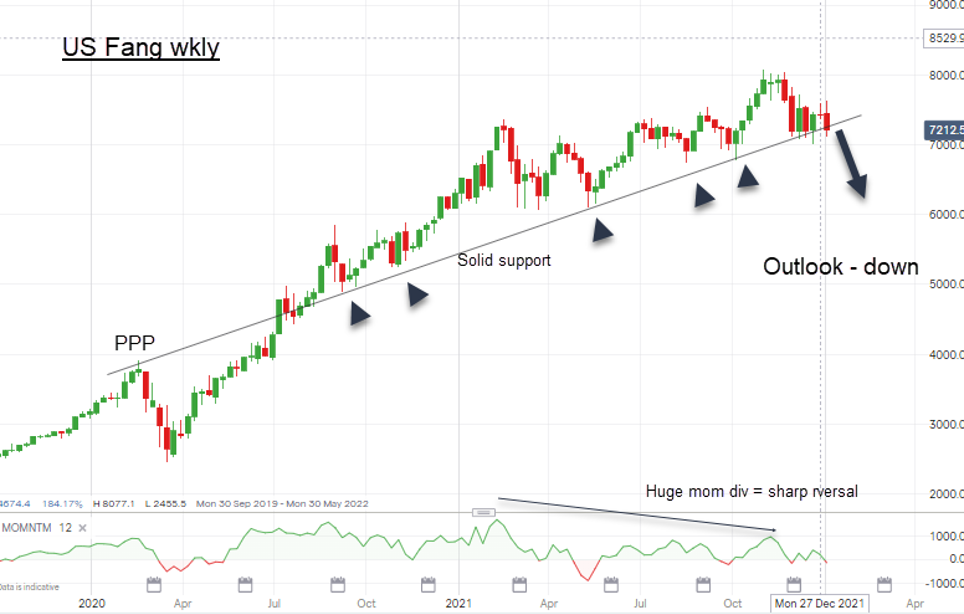
Past performance is not a guide to future performance.
I pointed out that the market was on the verge of breaking below my major line of support trendline. And since then, the break has occurred and this is the updated chart:
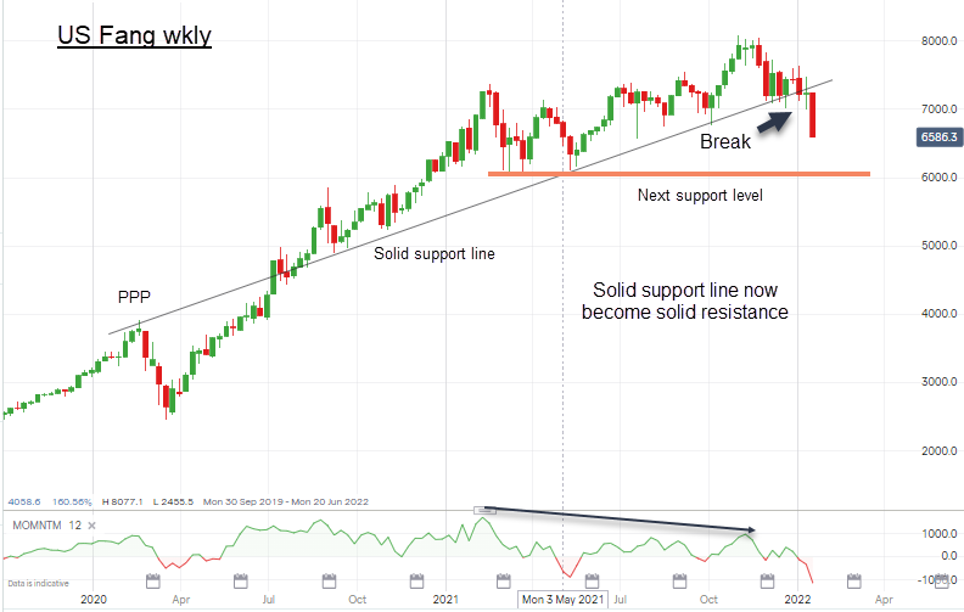
Past performance is not a guide to future performance.
Of course, the Netflix results posted last Wednesday was the excuse many took to take major profits, but that action had been flagged weeks ago with the revelation that, on balance, US corporate executives (the 'Insiders') had been unloading their company's shares by the tonne all year. In fact, they were the only sector to be net bearish while retail and institutional investors had been wildly net bullish.
This chart speaks volumes about the warning last year that the FANG Gang shares and many others were living on borrowed time. The insiders were dumping their company's shares at an all-time record pace at least up to January last year and almost certainly for the remainder of the year.
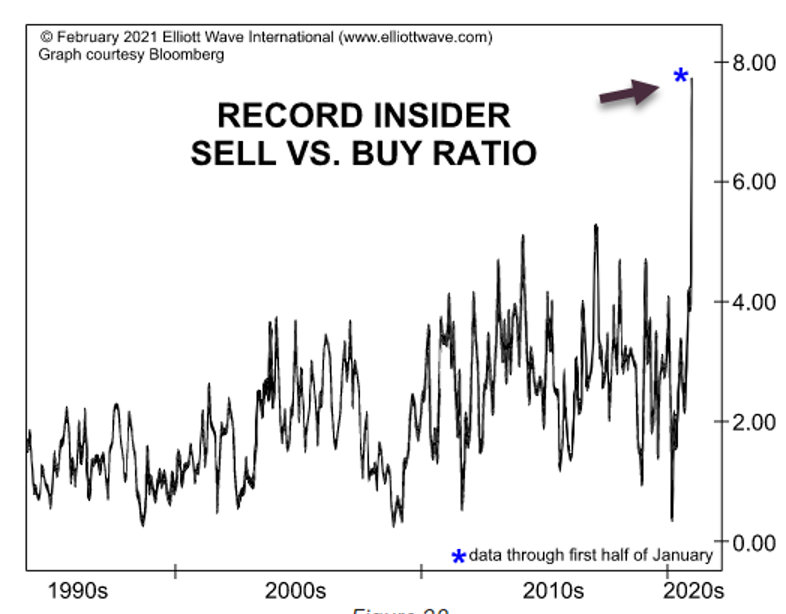
Past performance is not a guide to future performance. Chart courtesy of www.elliottwave.com
As I asked at the time, what did they know that others didn't? Maybe Netflix execs had an inkling the streaming party was about to be over at least for investors if not for content.
Of course, leading up to the November roll-over, many start-up tech shares on Nasdaq had been losing money. Here is a chart that should raise a few eyebrows among the bulls:
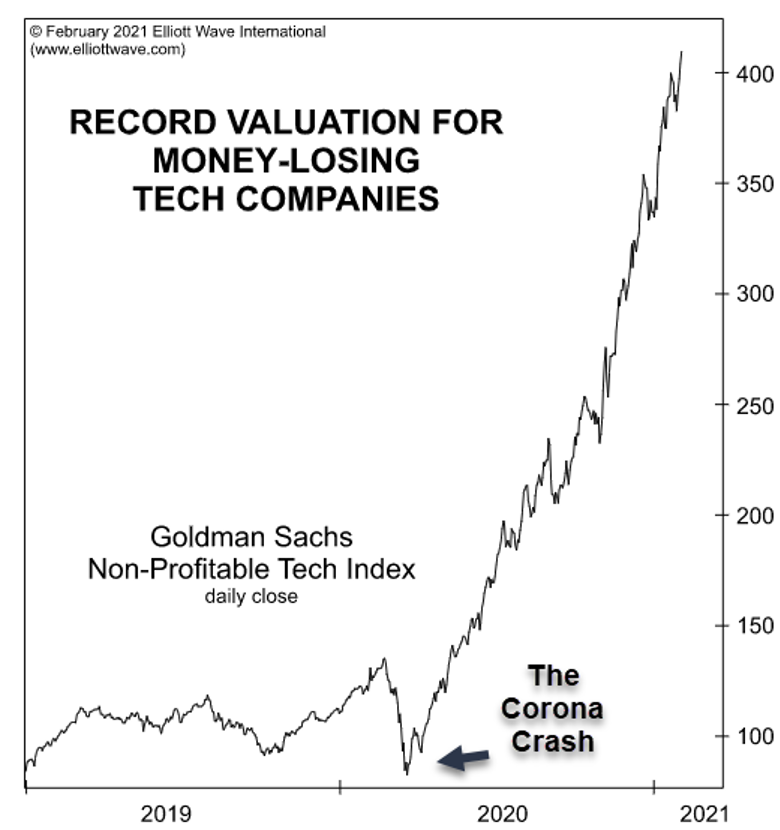
Past performance is not a guide to future performance. Chart courtesy of www.elliottwave.com
It should speak for itself and I venture that in the not-too-distant future, most investors would consider investing in a money-losing start-up to be akin to madness and/or suicidal. Today, for many investors, hope is prevailing over experience, but by the end of the year that should have reversed.
So is it too late to take profits in the FANGs (and much of tech) with shares well off their all-time highs? That is a question I am often asked in such a situation. For what it is worth, I offer this old-school market aphorism: “If you are going to panic, better to panic early”.
John Burford is a freelance contributor and not a direct employee of interactive investor.
These articles are provided for information purposes only. Occasionally, an opinion about whether to buy or sell a specific investment may be provided by third parties. The content is not intended to be a personal recommendation to buy or sell any financial instrument or product, or to adopt any investment strategy as it is not provided based on an assessment of your investing knowledge and experience, your financial situation or your investment objectives. The value of your investments, and the income derived from them, may go down as well as up. You may not get back all the money that you invest. The investments referred to in this article may not be suitable for all investors, and if in doubt, an investor should seek advice from a qualified investment adviser.
Full performance can be found on the company or index summary page on the interactive investor website. Simply click on the company's or index name highlighted in the article.
Disclosure
We use a combination of fundamental and technical analysis in forming our view as to the valuation and prospects of an investment. Where relevant we have set out those particular matters we think are important in the above article, but further detail can be found here.
Please note that our article on this investment should not be considered to be a regular publication.
Details of all recommendations issued by ii during the previous 12-month period can be found here.
ii adheres to a strict code of conduct. Contributors may hold shares or have other interests in companies included in these portfolios, which could create a conflict of interests. Contributors intending to write about any financial instruments in which they have an interest are required to disclose such interest to ii and in the article itself. ii will at all times consider whether such interest impairs the objectivity of the recommendation.
In addition, individuals involved in the production of investment articles are subject to a personal account dealing restriction, which prevents them from placing a transaction in the specified instrument(s) for a period before and for five working days after such publication. This is to avoid personal interests conflicting with the interests of the recipients of those investment articles.