Chart of the week: These stocks now reflect a new reality
24th December 2018 09:25
by John Burford from interactive investor
After accurately calling the top of the US tech market, technical analyst John Burford shares his latest take on the industry's biggest players.

A torrid year for Social Media and the Nasdaq
Was it sheer coincidence that in my 1 October post I covered several social media shares which were then some of the darlings of the Nasdaq – on the very day that it made its All Time High at 7,700?
It trades now at 6,200 for a crash of 1,500 points (just shy of 20%) in the space of only three months. In fact, it has given up all its gains for the year in an exciting – but unprofitable - round trip.
But the game changed in July when Facebook – which could do no wrong up to then – plunged by an eye-popping 25% in just four hours.
For such an almost instantaneous reversal of sentiment to occur after one of the greatest and longest bull markets in history was for me the bell that was rung at the top.
This is what I wrote on October 1:
"And when I saw that collapse, I knew the social media sector was in big trouble. Of course, signs of looming crisis were not exactly invisible – regulators were breathing hot and heavy about the more negative aspects with threats of regulation and I noted more MSM pieces detailing the harm social media is now doing to youngsters. The mood was certainly changing and it was only a matter of time before the share prices reflected that new reality."
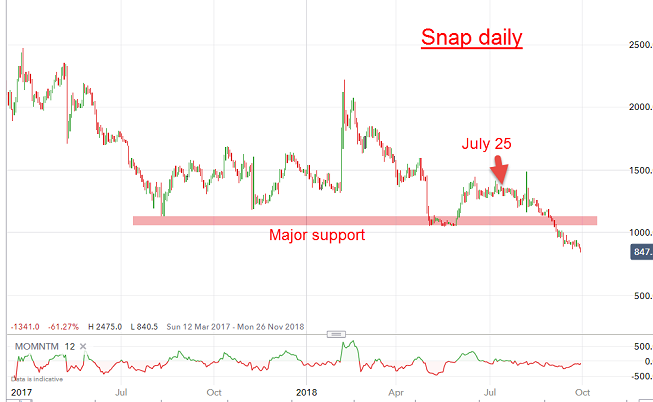
And reflect that new negative mood it certainly did. Here is Snap Inc, a share I covered in October and posted this chart:

Source: interactive investor Past performance is not a guide to future performance
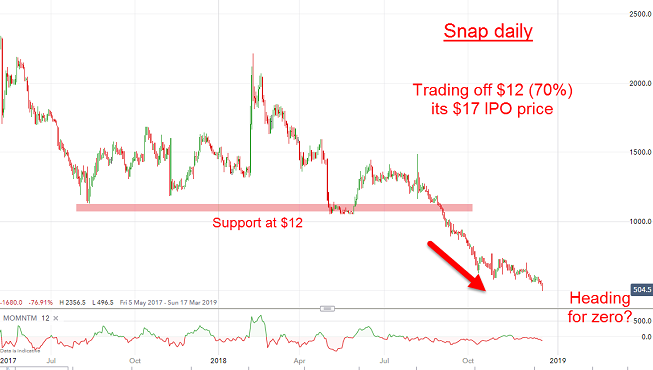
I noted the shares had just broken the shelf of major support at $12 and was headed lower. This is the current picture:

Source: interactive investor Past performance is not a guide to future performance
It is heading south at a rate of knots and has lost 70% so far off its IPO price of $17 (and then reached a high of $28). Ouch!!
This was my forecast in October:
"Taken together with Facebook, the two share patterns above offer little comfort for the bulls and I expect bear trends to continue, albeit punctuated by occasional bear market rallies.
"From a trading standpoint, shorting rallies is the preferred strategy."
That particular forecast has been validated in spades – here is Facebook today:

Source: interactive investor Past performance is not a guide to future performance
And they say no-one rings a bell at market tops. Humbug!
Wishing all my readers a very Happy Christmas!
For more information about Tramline Traders, or to take a three-week free trial, go to www.tramlinetraders.com.
*Horizontal lines on charts represent levels of previous technical support and resistance.
John Burford is the author of the definitive text on his trading method, Tramline Trading. He is also a freelance contributor and not a direct employee of interactive investor.
These articles are provided for information purposes only. Occasionally, an opinion about whether to buy or sell a specific investment may be provided by third parties. The content is not intended to be a personal recommendation to buy or sell any financial instrument or product, or to adopt any investment strategy as it is not provided based on an assessment of your investing knowledge and experience, your financial situation or your investment objectives. The value of your investments, and the income derived from them, may go down as well as up. You may not get back all the money that you invest. The investments referred to in this article may not be suitable for all investors, and if in doubt, an investor should seek advice from a qualified investment adviser.
Full performance can be found on the company or index summary page on the interactive investor website. Simply click on the company's or index name highlighted in the article.
Disclosure
We use a combination of fundamental and technical analysis in forming our view as to the valuation and prospects of an investment. Where relevant we have set out those particular matters we think are important in the above article, but further detail can be found here.
Please note that our article on this investment should not be considered to be a regular publication.
Details of all recommendations issued by ii during the previous 12-month period can be found here.
ii adheres to a strict code of conduct. Contributors may hold shares or have other interests in companies included in these portfolios, which could create a conflict of interests. Contributors intending to write about any financial instruments in which they have an interest are required to disclose such interest to ii and in the article itself. ii will at all times consider whether such interest impairs the objectivity of the recommendation.
In addition, individuals involved in the production of investment articles are subject to a personal account dealing restriction, which prevents them from placing a transaction in the specified instrument(s) for a period before and for five working days after such publication. This is to avoid personal interests conflicting with the interests of the recipients of those investment articles.