Chart of the week: time to fade out Netflix?
Netflix has been a blockbuster stock, but technical analyst John Burford asks if now is time to sell.
26th May 2020 12:30
by John Burford from interactive investor
Netflix has been a blockbuster stock, but technical analyst John Burford asks if now is time to sell.

One of the few beneficiaries of the global lockdowns is undoubtedly Netflix (NASDAQ:NFLX) – the giant leader in the subscription movie streaming sector.
But with competition from rivals including Disney (NYSE:DIS) and many others heating up, can it maintain its huge growth rate?
To catch the eyes of today’s mostly younger audiences, it has needed to spend big on its own productions where production values are on a par with the established big-budget Hollywood studio features.
But what has caught my eye are the price charts. The shares have been a major winner for the early birds, but I am asking if this is a great opportunity to take profits.
Source: interactive investor. Past performance is not a guide to future performance.
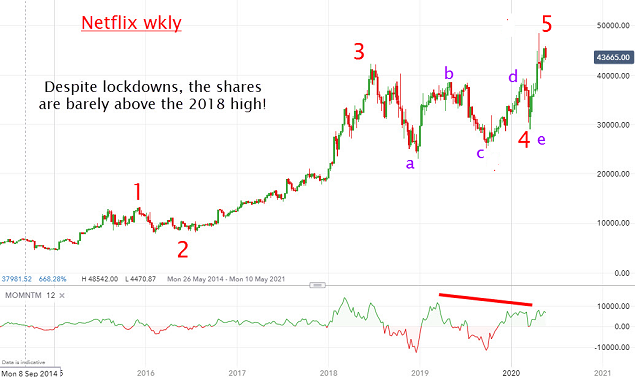
Here is the chart going back to 2014 when the shares were trading around $40. The entire advance has a clear five-wave form with wave 4 being a complex 5-wave pattern.
It is clear that the rally remained uninterrupted until it reached the wave 3 high at $422 in June 2018 for a tidy gain of a cool 900% in only four years. As they say, that beats the building society.
But since then, they have gone just about nowhere, despite reporting massive subscriber numbers. As I mentioned above, this has come at a massive cost of escalating production expenses – and huge debt loads. So is the market getting wind that its business model can no longer sustain such a heady share price?
The final wave 5 in the above chart has taken the shares to a new all-time high, but at the current market, they are only a few dollars above the 2018 ATH. That is not the sign of a strong bull market.
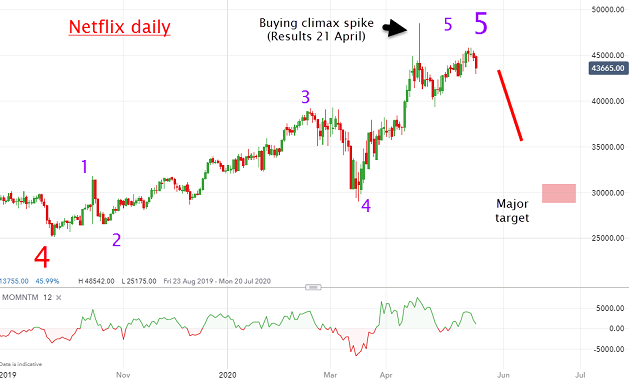
For more clues, here is the close-up of the wave 5.
Source: interactive investor. Past performance is not a guide to future performance.
And it too has a five-wave form. Remember, a major advance that occurs in five waves is complete when the fifth wave completes and then the trend reverses.
The latest results were released on 21 April and showed subscriptions were indeed booming. But note the market reaction – it rallied hard to a high of $485 and then plunged to unchanged on the day to create a spike which is a typical end to a strong bull run.
To me, that looks like a buying climax, when there were no more buyers left to buy and the sellers started taking over.
If my analysis is correct, the shares should decline from around here and my first major target is the $300 region with lower potential.
To those investors holding the shares, it appears prudent to take profits. And for swing traders, taking a short position around here should pay off.
For more information about Tramline Traders, or to take a three-week free trial, go to www.tramlinetraders.com.
John Burford is the author of the definitive text on his trading method, Tramline Trading. He is also a freelance contributor and not a direct employee of interactive investor.
These articles are provided for information purposes only. Occasionally, an opinion about whether to buy or sell a specific investment may be provided by third parties. The content is not intended to be a personal recommendation to buy or sell any financial instrument or product, or to adopt any investment strategy as it is not provided based on an assessment of your investing knowledge and experience, your financial situation or your investment objectives. The value of your investments, and the income derived from them, may go down as well as up. You may not get back all the money that you invest. The investments referred to in this article may not be suitable for all investors, and if in doubt, an investor should seek advice from a qualified investment adviser.
Full performance can be found on the company or index summary page on the interactive investor website. Simply click on the company's or index name highlighted in the article.
Disclosure
We use a combination of fundamental and technical analysis in forming our view as to the valuation and prospects of an investment. Where relevant we have set out those particular matters we think are important in the above article, but further detail can be found here.
Please note that our article on this investment should not be considered to be a regular publication.
Details of all recommendations issued by ii during the previous 12-month period can be found here.
ii adheres to a strict code of conduct. Contributors may hold shares or have other interests in companies included in these portfolios, which could create a conflict of interests. Contributors intending to write about any financial instruments in which they have an interest are required to disclose such interest to ii and in the article itself. ii will at all times consider whether such interest impairs the objectivity of the recommendation.
In addition, individuals involved in the production of investment articles are subject to a personal account dealing restriction, which prevents them from placing a transaction in the specified instrument(s) for a period before and for five working days after such publication. This is to avoid personal interests conflicting with the interests of the recipients of those investment articles.