Chart of the week: Why I like Metro Bank shares even more now
Down 94% in just 12 months, this analyst thinks the shares have reached an interesting price point.
14th October 2019 11:33
by John Burford from interactive investor
Down 94% in just 12 months, this analyst thinks the shares have reached an interesting price point.

On 29 July, I covered one of the challenger banks, Metro Bank (LSE:MTRO). It had been hugely disappointing for early investors as it has lost a massive 96% in value off its March 2018 high of £40 to the September low of £1.56. A complete disaster. And in July, I put my case for a buy when the market was at the £4 region as I sniffed an opportunity for a turn-around. But I was premature (which does happen sometimes).
But with the shares rising off that £1.56 low last month, I wish to reinstate my case for adding it to my Buy Low, Sell High list.
- Why Metro Bank just plummeted another 18%
- The bull case for Metro Bank shares
- Buy or sell Metro Bank shares?
In fact, last week was historic for several reasons. First, the US dollar and Treasury bonds both made major tops and are heading strongly lower (yields rising). Sterling also made a major low and is headed much higher.
Second, bank shares made major lows on Thursday (as predicted in my September 9 coverage of Barclays) as bond yields are now moving higher – totally against consensus. It seemed the whole world was convinced interest rates were only going one way – down. Some were even predicting US rates would go negative. I did not.
So, with profit margins on bank loans due to ramp up with rising long-term yields, the leverage on bank shares should be very large – and that is making bank shares especially attractive now.
Can Metro rise from the ashes in this bullish scenario?
This was the long-term chart I showed in July:
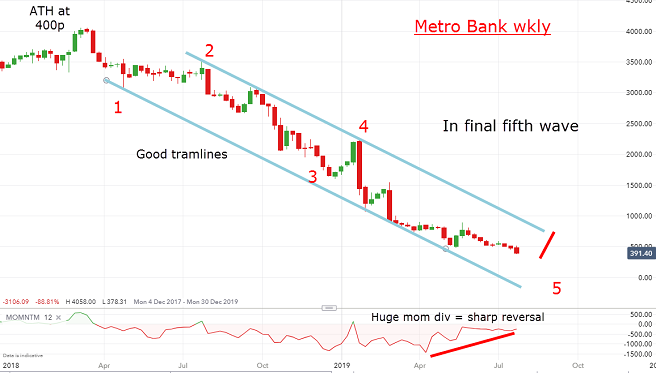
Source: interactive investor Past performance is not a guide to future performance
I had good reason to suggest the shares were in the final fifth wave (remember, fifth waves are always ending waves) – the question was this: had it made a major low at the then current £3.90 mark?
As we all know now, the answer was no. But with the huge momentum divergence building, I felt sure when the low came, the reversal would be very sharp.
This is the updated chart on the daily showing the final fifth wave:
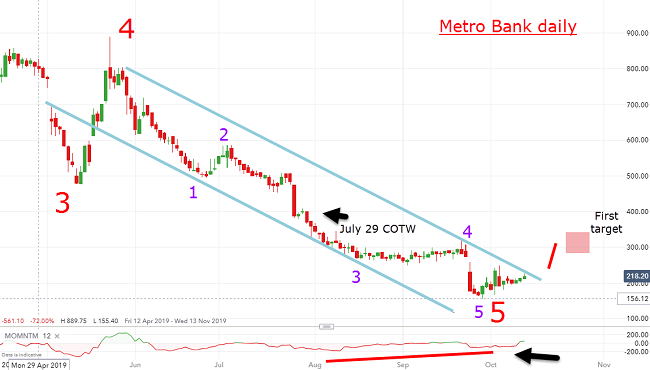
Source: interactive investor Past performance is not a guide to future performance
Now, with the new low, I have a potentially complete purple five waves in red wave 5 to the £1.56 low. A solid break above upper trendline should result in a sharp move to my first target at £3 and then my next major target at the £8 region.
The shares remain one of the most shorted stocks, and reports suggest there was more shorting pressure last week even after chairman and co-founder Vernon Hill promised to step down. Together, that can only be potentially very bullish news.
A new low below £1.56 is now much less likely and a possible dip off the tramline resistance could well set up a buying opportunity.
For more information about Tramline Traders, or to take a three-week free trial, go to www.tramlinetraders.com.
John Burford is the author of the definitive text on his trading method, Tramline Trading. He is also a freelance contributor and not a direct employee of interactive investor.
These articles are provided for information purposes only. Occasionally, an opinion about whether to buy or sell a specific investment may be provided by third parties. The content is not intended to be a personal recommendation to buy or sell any financial instrument or product, or to adopt any investment strategy as it is not provided based on an assessment of your investing knowledge and experience, your financial situation or your investment objectives. The value of your investments, and the income derived from them, may go down as well as up. You may not get back all the money that you invest. The investments referred to in this article may not be suitable for all investors, and if in doubt, an investor should seek advice from a qualified investment adviser.
Full performance can be found on the company or index summary page on the interactive investor website. Simply click on the company's or index name highlighted in the article.
Disclosure
We use a combination of fundamental and technical analysis in forming our view as to the valuation and prospects of an investment. Where relevant we have set out those particular matters we think are important in the above article, but further detail can be found here.
Please note that our article on this investment should not be considered to be a regular publication.
Details of all recommendations issued by ii during the previous 12-month period can be found here.
ii adheres to a strict code of conduct. Contributors may hold shares or have other interests in companies included in these portfolios, which could create a conflict of interests. Contributors intending to write about any financial instruments in which they have an interest are required to disclose such interest to ii and in the article itself. ii will at all times consider whether such interest impairs the objectivity of the recommendation.
In addition, individuals involved in the production of investment articles are subject to a personal account dealing restriction, which prevents them from placing a transaction in the specified instrument(s) for a period before and for five working days after such publication. This is to avoid personal interests conflicting with the interests of the recipients of those investment articles.