Chart of the week: will Summer Solstice signal market downturn?
Lack of alternative investment opportunities has fuelled a rally, but there are several warning signs.
22nd June 2020 11:06
by John Burford from interactive investor
Lack of alternative investment opportunities has fuelled a rally, but there are several warning signs.

Is FTSE 100 on a cliff edge?
Most investors and virtually all professional market analysts and all economists believe price charts are simply pretty pictures that contain little if any forecasting value. I could not disagree more. And today I show charts that are shouting the very likely way directly ahead for the UK market (with the proviso that all forecasts are probabilistic).
My COTW posts this month have intimated strongly that the impressive rally off the Corona Crash lows in March is really a bear market rally and not the start of a new uptrend. And events last week have more than ever convinced me that shares are heading for a lengthy decline very soon.
Last week, I asked: Are shares now poised for a savage decline? I believe they are and, in fact, the decline should be at least as vigorous as the Corona Crash.
- Chart of the week: are shares poised for more savage declines?
- How it’s possible to justify this stock market rally
- For more technical analysis and charting views, click here
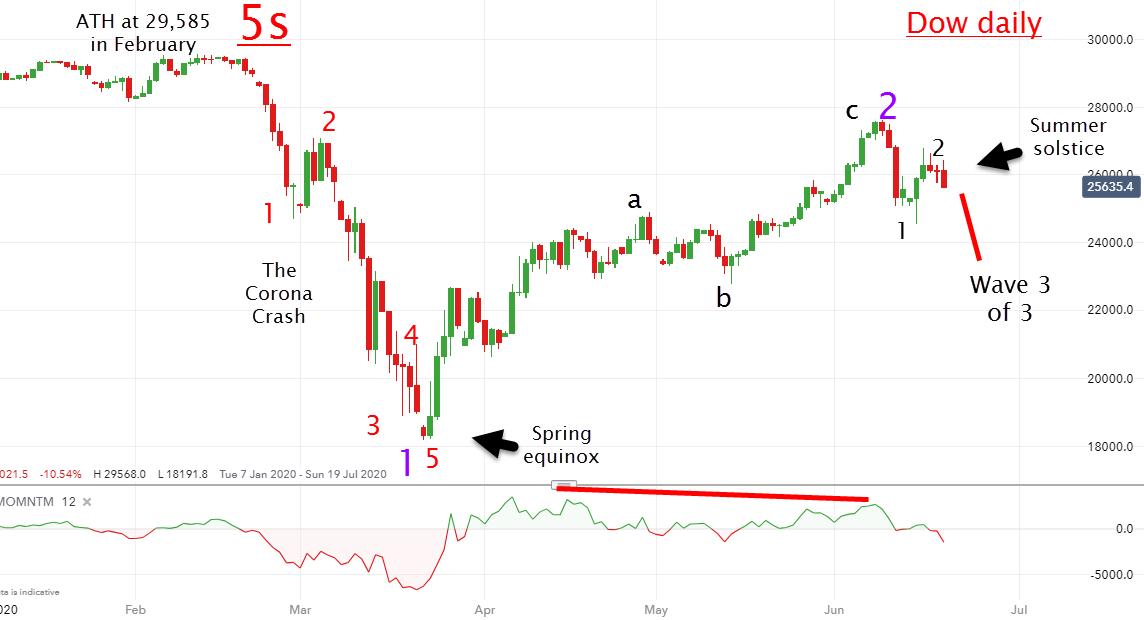
Here is the Dow Jones index covering the recent period:
Source: interactive investor. Past performance is not a guide to future performance.
It is a fact that market turns often (but not always) occur around the times of the two Equinoxes and Solstices. It seems that human behaviour – in the form of share buying/selling at least – also makes a transition as our Mother Earth spins and rotates around our life-giving sun.
The Corona Crash was halted right on this year’s Spring Equinox in March when the market reversed from hard down to hard up. And today at the Summer Solstice, this is an opportune time for a similar transition, but this time from up to down.
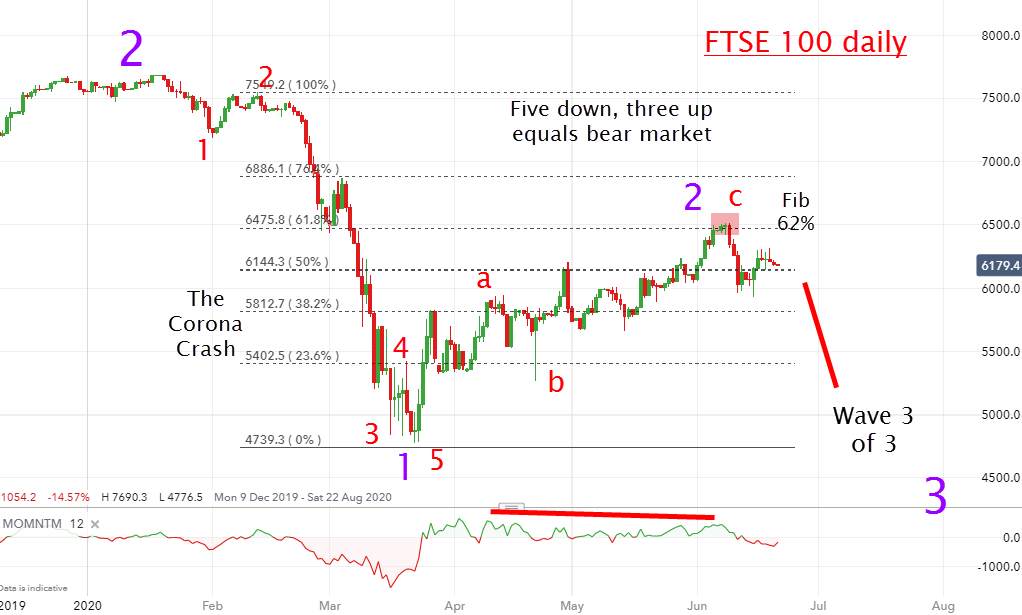
If my wave labels are correct, I expect a wave 3 of 3 down – and these are the longest and strongest in the book. Here is the FTSE 100 index showing a similar pattern to the Dow:
Source: interactive investor. Past performance is not a guide to future performance.
The stand-out feature is that after the almost straight-down nature of the Corona Crash, the recovery rally contains mostly overlapping stair-step waves – and this is the hallmark of corrective behaviour to the main trend (down).
Remember, despite the record amount of ‘stimulus’ the US Federal Reserve (and Bank of England) has provided, the Dow is still 13% below its February all-time high, while the FTSE made its record high a full two years ago.
The current rally has carried to the Fibonacci 62% retrace, which is a common target for a complete retracement of the main trend. That target was hit two weeks ago and, since then, we have seen a sharp retreat and, last week, a partial recovery which appears to me to be the final thrust attempt higher.
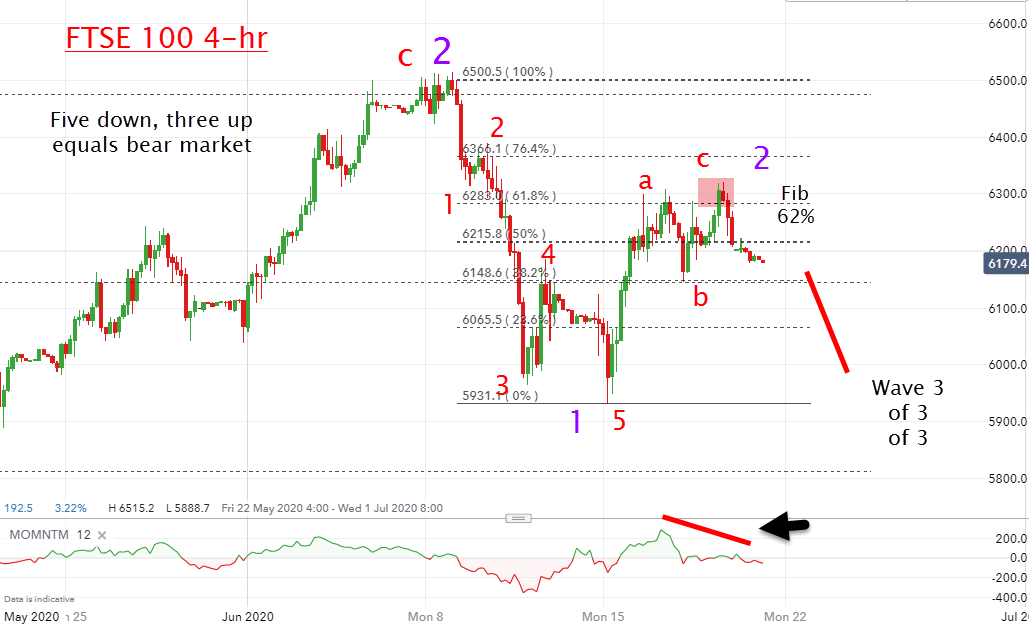
And to show that wave patterns are not simply random squiggles on a chart (as so many ‘conventional’ analysts believe), here is a close-up of June action on the 4-hour chart:
Source: interactive investor. Past performance is not a guide to future performance.
The resemblance to the daily chart is exceedingly close – a five down and a three up with the up wave terminating at the critical Fibonacci 62% retrace. Here, the momentum divergence is acute, and that clearly signals a very hard decline to come.
The implication is clear: The market is now poised for a magnificent decline in third waves of many degrees of scale. Only an unlikely advance above 6,320 would send me back to my drawing board.
For more information about Tramline Traders, or to take a three-week free trial, go to www.tramlinetraders.com.
John Burford is the author of the definitive text on his trading method, Tramline Trading. He is also a freelance contributor and not a direct employee of interactive investor.
These articles are provided for information purposes only. Occasionally, an opinion about whether to buy or sell a specific investment may be provided by third parties. The content is not intended to be a personal recommendation to buy or sell any financial instrument or product, or to adopt any investment strategy as it is not provided based on an assessment of your investing knowledge and experience, your financial situation or your investment objectives. The value of your investments, and the income derived from them, may go down as well as up. You may not get back all the money that you invest. The investments referred to in this article may not be suitable for all investors, and if in doubt, an investor should seek advice from a qualified investment adviser.
Full performance can be found on the company or index summary page on the interactive investor website. Simply click on the company's or index name highlighted in the article.
Disclosure
We use a combination of fundamental and technical analysis in forming our view as to the valuation and prospects of an investment. Where relevant we have set out those particular matters we think are important in the above article, but further detail can be found here.
Please note that our article on this investment should not be considered to be a regular publication.
Details of all recommendations issued by ii during the previous 12-month period can be found here.
ii adheres to a strict code of conduct. Contributors may hold shares or have other interests in companies included in these portfolios, which could create a conflict of interests. Contributors intending to write about any financial instruments in which they have an interest are required to disclose such interest to ii and in the article itself. ii will at all times consider whether such interest impairs the objectivity of the recommendation.
In addition, individuals involved in the production of investment articles are subject to a personal account dealing restriction, which prevents them from placing a transaction in the specified instrument(s) for a period before and for five working days after such publication. This is to avoid personal interests conflicting with the interests of the recipients of those investment articles.