Chart of the week: are shares poised for more savage declines?
Market moves have severe implications for bulls as shares are teed up for a massive move lower.
15th June 2020 09:44
by John Burford from interactive investor
Market moves have severe implications for bulls as shares are teed up for a massive move lower.

Since early this year, shares have plunged in what I call the Corona Crash, but since 23 March they had staged a tremendous recovery. In fact, the tech-heavy Nadaq has more than recovered all its losses and made a new all-time high last week (unlike all other major US indexes).
So have we started a new bull run, as so many pundits proclaim as they see beyond the present economic collapse during these soon-to-end pandemic lockdowns, and into to the sunny uplands of strong economic growth?
Pundits are urging the UK government to take this opportunity to boost investment in the so-called ‘green’ agenda and get on track to get to the nirvana of a ‘carbon-free’ economy by making major investments in this area.
- Stock market rally poll: too much too soon, or only the start?
- Stock market slump: reality check after grim data
- Take control of your retirement planning with our award-winning, low-cost Self-Invested Personal Pension (SIPP)
So what is the likelihood of success of the government actually favouring companies that produce stable well-paid jobs in quantity, produce huge boosts to GDP and actually do no harm to other sectors (for example, the oil sector)?
Readers with long memories may recall their involvement with British Leyland and British Steel. Hmm. The historical record apparently has little place in today’s government plans.
Once in a while, I come across a chart that stands out like a beacon (in less than a thousand words) that at one glance shows how ridiculous are share valuations today:
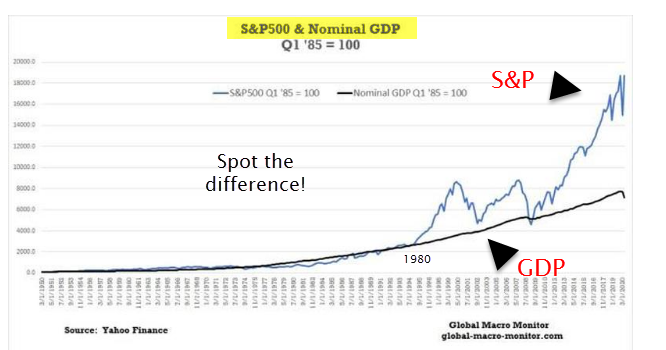
Up until the 1980s, the S&P valuation kept track with nominal US GDP, as is taught in all good investing books. But then, shares became more and more over-valued until the gap is now as yawning wide as it has ever been. What has brought this anomaly about? It is a steady build-up of bullish confidence in the future (punctuated by brief periods of doubt).
So, with the pandemic bringing many industries to a dead stop, is this the ideal moment when valuations start to get re-rated? The high-tech sector has been an intense area of speculation in recent years as noted above.
Here in the UK, we have a similar situation in the FTSE – and this time I am showing the FTSE 250, which contains several of our tech companies:
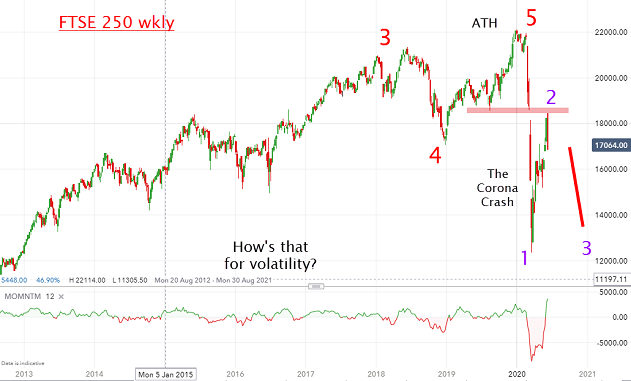
Source: interactive investor. Past performance is not a guide to future performance.
The index made its all-time high on the last trading day of 2019 and, in March, it was engulfed in the Corona Crash, taking the index to an eight-year low - wiping out eight years of gains in just four weeks. As they say: Markets fall out of the window faster than they climb the stairs. In this case, a lot faster.
So, there has been some recovery as the last dying embers of the bullish mania kept bullish hopes alive. Here is a close up of recent action:
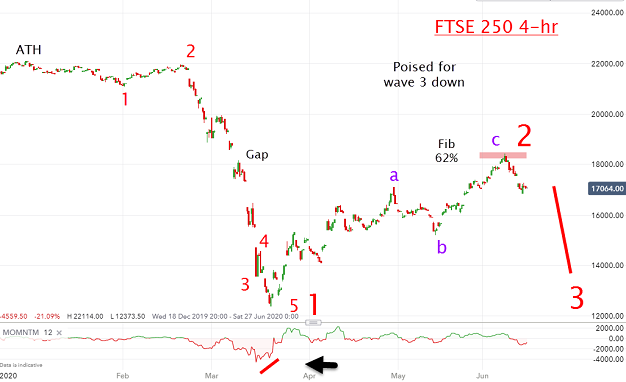
Source: interactive investor. Past performance is not a guide to future performance.
If my wave labels are correct, we are now teed up for a massive third wave lower, and only a sharp rally above last week’s high would send me back to the drawing board.
Of course, the implications are severe for bulls. I sense that this week will go down in financial history.
Flash Monday morning: Shares are in full retreat with the Dow Jones futures price down by 1,000 points (4%).
For more information about Tramline Traders, or to take a three-week free trial, go to www.tramlinetraders.com.
John Burford is the author of the definitive text on his trading method, Tramline Trading. He is also a freelance contributor and not a direct employee of interactive investor.
These articles are provided for information purposes only. Occasionally, an opinion about whether to buy or sell a specific investment may be provided by third parties. The content is not intended to be a personal recommendation to buy or sell any financial instrument or product, or to adopt any investment strategy as it is not provided based on an assessment of your investing knowledge and experience, your financial situation or your investment objectives. The value of your investments, and the income derived from them, may go down as well as up. You may not get back all the money that you invest. The investments referred to in this article may not be suitable for all investors, and if in doubt, an investor should seek advice from a qualified investment adviser.
Full performance can be found on the company or index summary page on the interactive investor website. Simply click on the company's or index name highlighted in the article.
Disclosure
We use a combination of fundamental and technical analysis in forming our view as to the valuation and prospects of an investment. Where relevant we have set out those particular matters we think are important in the above article, but further detail can be found here.
Please note that our article on this investment should not be considered to be a regular publication.
Details of all recommendations issued by ii during the previous 12-month period can be found here.
ii adheres to a strict code of conduct. Contributors may hold shares or have other interests in companies included in these portfolios, which could create a conflict of interests. Contributors intending to write about any financial instruments in which they have an interest are required to disclose such interest to ii and in the article itself. ii will at all times consider whether such interest impairs the objectivity of the recommendation.
In addition, individuals involved in the production of investment articles are subject to a personal account dealing restriction, which prevents them from placing a transaction in the specified instrument(s) for a period before and for five working days after such publication. This is to avoid personal interests conflicting with the interests of the recipients of those investment articles.