Charting for beginner investors: candlesticks and how to use them
Candlesticks are very good at explaining the psychology behind market moves during the trading day.
30th September 2020 09:55
by Nicole Elliott from interactive investor
Candlestick charts are very good at helping understand the psychology behind market moves during a typical trading day. In the second part of her introduction to technical analysis, charting expert Nicole Elliott explains why and what they mean.

This article is intended as a primer for the study of Japanese candlestick charting, and no, I’m not throwing you in at the deep end. Please don’t think that it’s all about Oriental philosophy or complex mathematics – it is neither. It is a very visual method of recording price action in financial markets, making it quicker and easier to spot important shifts in behaviour.
Munehisa Homma (1724-1803), the youngest son from a provincial northern Japanese town, unusually inherited the family business. He promptly moved to Osaka, set up his wholesale rice business trading actual physical rice, and also futures – a price that traders believe a product might be worth in the future – on the Dojima exchange.
He is said to have created a system to record daily price moves not as digits – which prevailed then and still does today in the financial pages of the newspapers – but in graph form. Not a continuous line of prices moves, but discreet intervals, usually daily intervals, noting the price at the start of the day’s trading – the open price – high and low price of the day, and closing prices. This is visually presented on a chart by a vertical line from high to low, and small horizontal lines for the open (on the left) and close (on the right).
Daily bar chart
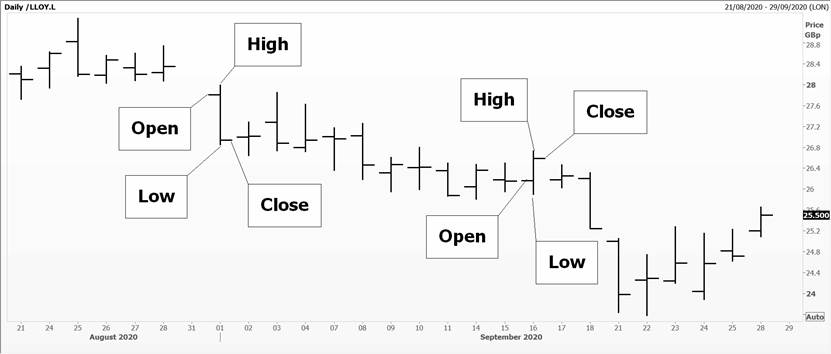
Source: Thomson Reuters Eikon. Lloyds Banking Group Plc. Note: candlesticks were originally designed for daily intervals. Today, they are used for all and any time frames. Past performance is not a guide to future performance.
Mr Homma’s breakthrough was differentiating between where the bulk of trading had occurred, and the outlying prices where a different psychology prevailed. He did this by creating a fatter bit between open and closing prices – the candle – and wicks or whiskers (as they’re called in Japanese) for the high and low. If the market closed down on the day, the candle was coloured in black. Rumour has it that this clever man still holds the record for the longest run of consecutive winning trades – 100!
Steve Nison, an American investment banker based in Tokyo, introduced candlesticks to the West with his book Japanese Candlestick Charting Techniques in 1991. His methods were snapped up very quickly by others in the banking industry. Most software and trading packages offer these today as the default option because they are speedy to work with.
They also focus on the psychology that moves financial markets during the trading day. If the opening price is well above the previous day’s close, this emphasises the aggressive nature of buyers. Conversely, opening at a much lower price than the night before indicates desperate sellers wanting to get rid of holdings. Gaps between the open price and previous close are, in themselves, an important element of the charts.
Daily candlestick chart
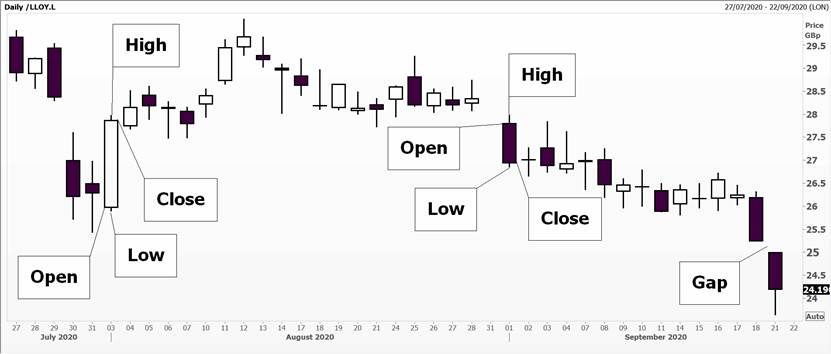
Source: Thomson Reuters Eikon. Lloyds Banking Group Plc. Past performance is not a guide to future performance.
Similarly, a market that opens at its lowest point and then carries on marching steadily higher to form a big white candle, shows that there are serious buyers behind the move. A big black candle, where prices continue to plough on down all day, indicates that there is a steady stream of selling orders coming in at increasingly lower prices. Both are known as Marabuzo ( “shaved head” with no wick) candles, where size matters!
A trickier type of candle is one which tests the upside (goes up a lot), then the downside (falls a lot) – or vice versa – and closes pretty much where it started. Sometimes the daily range can be big, sometimes tiny; it doesn’t matter. These are known as “doji” candlesticks.
“Doji” is the Japanese for spinning top, but not necessarily to do with the top of the market. It is the name for a child’s spinning top, a wooden spool activated by twirling it at the top or with a string. As the spinning top slows, you know that it’s about to skid off in another direction, but you’ve no idea which way.
This candlestick denotes indecision in the chart and a market looking for direction. If you spot a doji, be warned: the trend might be about to change, so prepare yourself.
If these have a very long wick at one end, and if they appear after a long bull or bear run, they are known as a “shooting star” or “hammer”, respectively. These tend to be very powerful one-day reversal signals because they encapsulate a dramatic change in investor psychology. From euphoria or overwhelming pessimism, there is a complete about-face in sentiment, one which investors should be keen to capture and profit from.
In the early 1980s, when I was trading UK Gilt futures for my clients and for the bank itself, I spotted a hammer at the lowest price gilts had set in many years. I told my friends at stockbroker Samuel Montagu in the booth next to ours. At the end of trading the following day, their head trader asked: “Nicole, did you fill your boots?”. “Not nearly enough”, I answered modestly – because for every winner there is a loser.
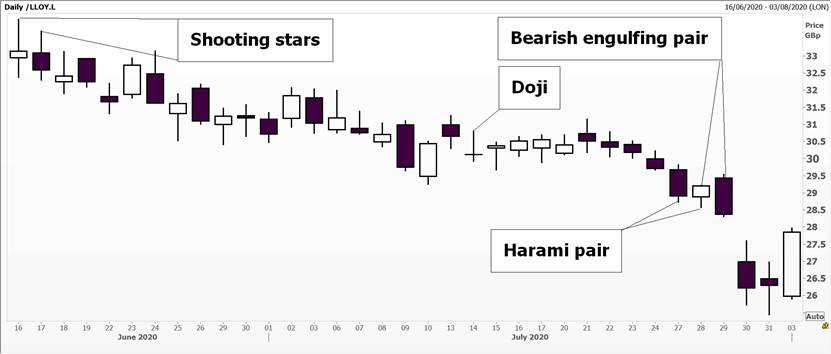
Shooting star, Hammer and Doji candlesticks
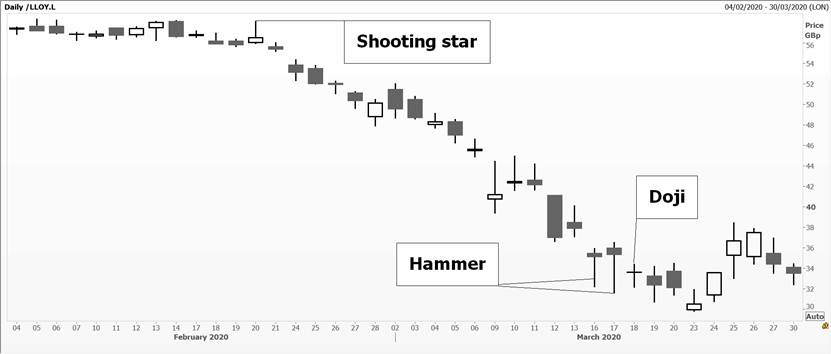
Source: Thomson Reuters Eikon. Lloyds Banking Group Plc, daily candlestick chart. Past performance is not a guide to future performance.
Some candles work in pairs. A pretty powerful one is known as a “bearish engulfing formation”, where the black body of the second candle is bigger than that of the white one that precedes it.
Conversely, if the second candle is a big white one, following a smaller black one, it is a bullish engulfing candle. In the West, we have a similar concept called “tweezers” (tops or bottoms), where two sizeable candles reverse the previous day’s move. These are reliable patterns, and investors will typically look to trim holdings at the very least, and possibly consider reversing them.
Reversing means switching from being a buyer (“going long” in the trade jargon) to becoming a seller (“going short”). This is very easy to do when trading futures, options and contracts for difference, or CFDs. With shares, market professionals and hedge funds are the only ones who can do this fairly easily.
Engulfing candles
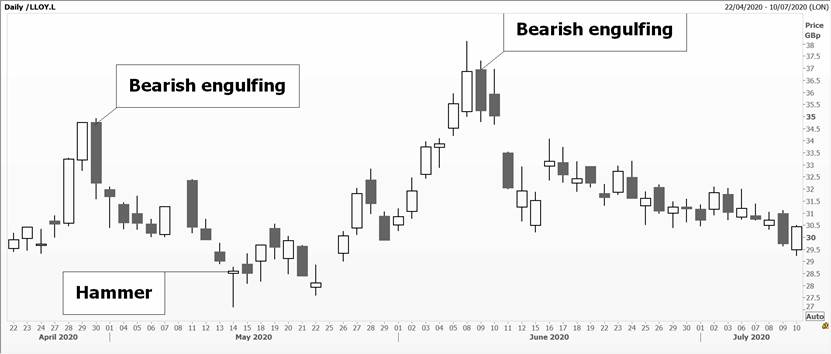
Source: Thomson Reuters Eikon. Lloyds Banking Group Plc, daily candlestick chart. Past Performance is not a guide to future performance.
A similar but less powerful signal is called a Harami (pregnant) candlestick pair, where the body of the second candle lies completely inside the body of the first one, where the colour sequence can vary. The second candle is the “baby” inside its mother’s body. Think “pregnant pause”. Here, chart watchers typically wait and watch what happens next before putting on any trades.
A Harami pair
Source: Thomson Reuters Eikon. Lloyds Banking Group Plc, daily candlestick chart. Past performance is not a guide to future performance.
Nicole Elliott is a freelance contributor and not a direct employee of interactive investor.
A graduate of the London School of Economics and Political Science (BSc social psychology), Nicole Elliott has worked in banks in the City of London for the last 30 years. Whether in sales, trading or forecasting, technical analysis has always been the bedrock of her thinking. Her key expertise lies within all areas of Treasury: foreign exchange, money markets, fixed income and commodities. She has also added to the body of knowledge of the industry, writing the first Western book on Ichimoku Cloud Charts. Strong media links and a cult following are due to her prescient calls on the markets and often entertaining format.
These articles are provided for information purposes only. Occasionally, an opinion about whether to buy or sell a specific investment may be provided by third parties. The content is not intended to be a personal recommendation to buy or sell any financial instrument or product, or to adopt any investment strategy as it is not provided based on an assessment of your investing knowledge and experience, your financial situation or your investment objectives. The value of your investments, and the income derived from them, may go down as well as up. You may not get back all the money that you invest. The investments referred to in this article may not be suitable for all investors, and if in doubt, an investor should seek advice from a qualified investment adviser.
Full performance can be found on the company or index summary page on the interactive investor website. Simply click on the company's or index name highlighted in the article.