Commodities Focus: Where gold finds buying interest
28th August 2018 12:35
by Rajan Dhall from interactive investor
Industry analyst Rajan Dhall discusses where investors should expect oil, gold and copper prices to move this week.

The US and Mexico have managed to agree a trade deal over the long weekend - could this mean that Trump could back down on China?
Not necessarily. This deal vastly benefits the US and, in fact, controls some of the wage restrictions in Mexico. If a car manufacturer wants to make cars that are sold in the US, they will have to pay Mexican workers $16 per hour to ensure that US labourers are not undercut (on 40-45% of each vehicle).
Slightly contentious by anyone's standards to let Trump dictate what your workers are paid - no? Regardless, it does show the world that Trump can organise a trade deal and there is still hope for countries like China and Canada.
It may, however, show that Trump is just showing the world that a deal can be done, if you are willing to bend over backwards to get it. China is unlikely to retreat in the same way and the world knows it. Mexico is a developing nation, but China's industry is mature and the country has more leverage.
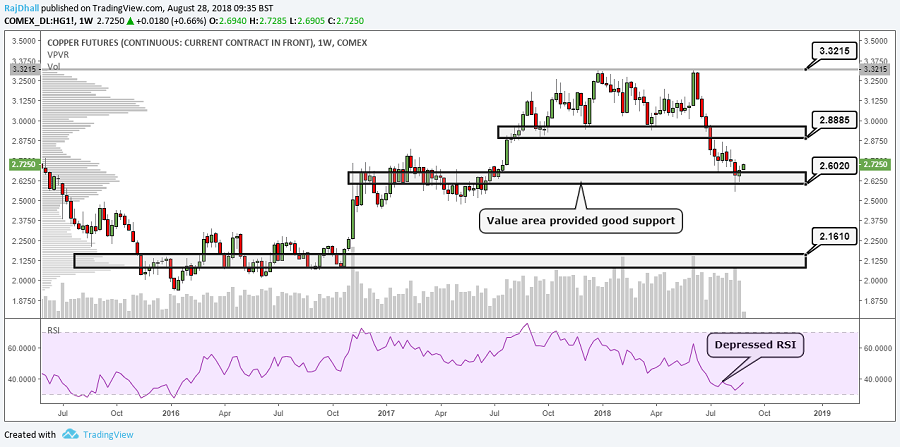
Copper is at an interesting juncture at the moment. China is set to boost investment in infrastructure projects to manage the shortfall from the trade dispute. This is obviously a boost for basic materials, but if China and the US manage to sort out their differences we could see a double boost!
On a technical note, things are looking up for copper on the weekly chart. We rejected the $2.60/lb value area and now are showing signs of a retracement. The RSI has also turned but is still at pretty depressed levels.
At $2.73/lb there is an interesting resistance on the lower timeframes that should be taken note of, although, if we do break it and close above, it will give the market an indication that this retracement is not over.
Past performance is not a guide to future performance
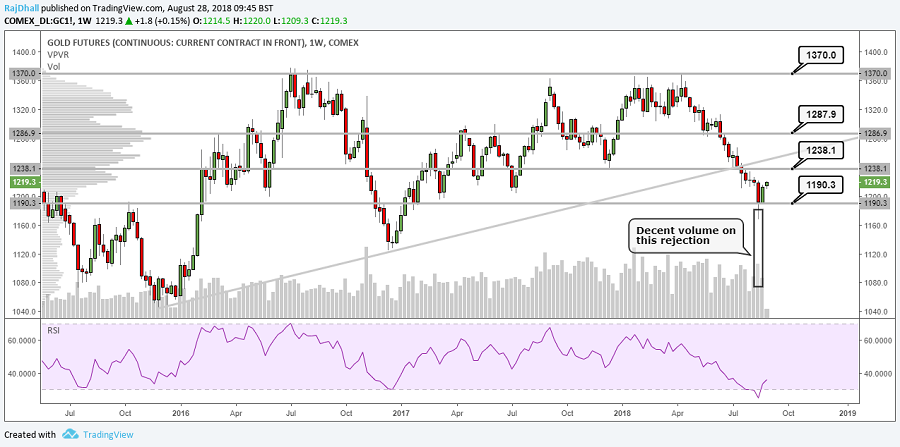
Gold has pushed back through the $1,200/oz level and analysts are waiting to see if a base formation will become established.
A key point on the chart has to be the volume noted at the rejection candle two weeks ago. There seems to be a large amount of buying interest at or between $1,167-91/oz.
Again, there were rumours of Russian central bank buying this week. Analysts will wait for the gold reserves data for confirmation which last stood at 1,909.80 in July.
Past performance is not a guide to future performance
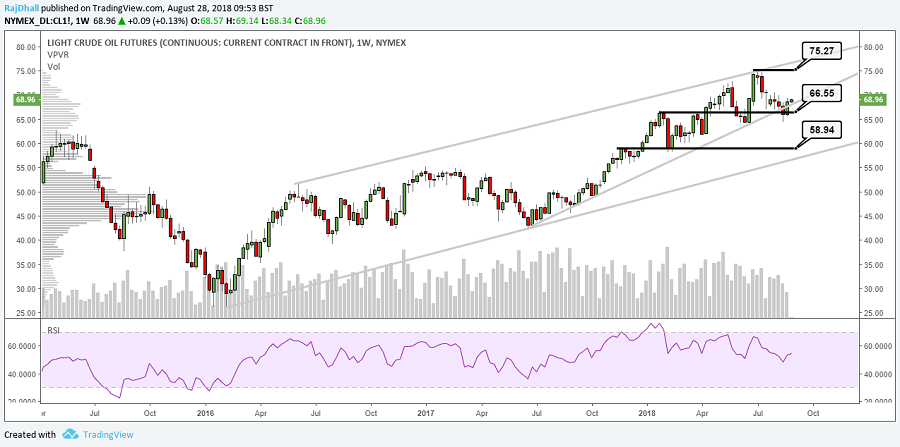
Oil still continues to be the best performing major commodity in recent times, and the markets are noting further compliance with the OPEC production increases this week.
Around $70/bbl seems to be the sticking point for the liquid gold which has been stated by Russia and Saudi Arabia as a comfortable level. Last week, Department of Energy (DoE) and API inventory levels produced a draw and the market was told that the US could step in to fill the void by any loss that may come from Iran (sanctions).
This was a key insight into the reason US production has been increasing recently along with the busy holiday season. From a price perspective, the OPEC story has dissipated and US dollar fluctuations seem to be dictating movement. The momentum still seems to be with the bulls so keep an eye on a break of $70/bbl.
Past performance is not a guide to future performance
These articles are provided for information purposes only. Occasionally, an opinion about whether to buy or sell a specific investment may be provided by third parties. The content is not intended to be a personal recommendation to buy or sell any financial instrument or product, or to adopt any investment strategy as it is not provided based on an assessment of your investing knowledge and experience, your financial situation or your investment objectives. The value of your investments, and the income derived from them, may go down as well as up. You may not get back all the money that you invest. The investments referred to in this article may not be suitable for all investors, and if in doubt, an investor should seek advice from a qualified investment adviser.
Full performance can be found on the company or index summary page on the interactive investor website. Simply click on the company's or index name highlighted in the article.