Commodities outlook: All eyes on Trump, Chinese and Saudi
We look at how US-China trade talks and volatility in the Middle East are moving oil and copper prices.
11th October 2019 11:51
by Rajan Dhall from interactive investor
We look at how US-China trade talks and volatility in the Middle East are moving oil and copper prices.
The outlook for commodities is brighter after the tone in the talks between the US and China improved.
This event has been widely anticipated across all financial markets as global growth stalled following the 18 month-long spat between the two superpowers. Just last night Trump addressed reporters and said the talks went "very very well".
This is not the first time we have been fed positive information before the mood turns sour. It makes headline watching very important as news that a deal has been struck or not could come at any time today. The global financial markets reacted well to the developments. The major indices all rose off the back of the optimism and commodities currencies also rallied.
Looking at copper, on the daily chart below you can see that the recent price action has been positive. The futures contract has taken the $2.60 per pound handle once again and is headed toward the $2.62 per pound resistance level. Above that, there is another prominent resistance at $2.70 per pound.
In terms of trend, at the moment we are still in a downtrend, but a higher low has now been created. A technical trend change can only occur once $2.70 per pound is broken. If the trade deal is agreed today, there is the possibility that the resistance levels above the current price will come into play.
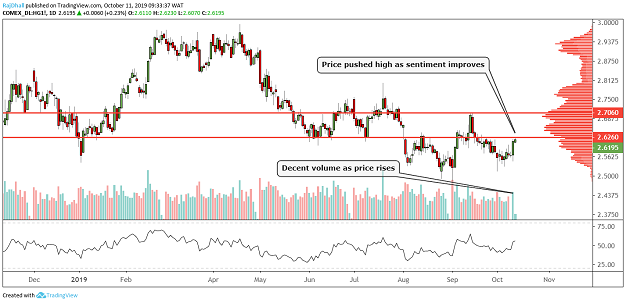
Source: TradingView Past performance is not a guide to future performance
Oil markets are dealing with the current sensitive situation in the Middle East. It has been said that three Iranian oil takers have been put out of commission, with one saying it had been hit by missiles. It has not been confirmed if the missiles were from Saudi Arabia but there are rumours suggesting that this is the case.
Elsewhere, OPEC delegates are meeting today to discuss the state of the market and whether deeper production cuts are needed. The OPEC Secretary-General Mohammed Sanusi Barkindo commented yesterday:
"All options are open. As we approach December, we will be faced with real data for 2020 which will enable us to probably review the current arrangement and come up with a decision that probably will cover the whole of the year."
So, there is a suggestion that more cuts may be implemented to cover next year, but the amount has not been decided on.
The price chart below is the daily West Texas Intermediate (WTI) futures contract. The $50.50 per barrel level has been supported once again over the last week or so, as so-called hammer candles* show rejection of the downside areas.

Source: TradingView Past performance is not a guide to future performance
Over the past two days, the price has risen above 6% from the low of $51.38 per barrel yesterday. Now the next resistance level is at $55.22 per barrel, but the mean value area stands at $56 per barrel. This value is represented by the peak of the bell curve on the volume profile indicator on the right-hand side of the chart.
If the tension in the Middle East continues, then $56 per barrel could be retaken, but we need more confirmation that Saudi Arabia was responsible for the attacks on Iranian oil tankers near the Red Sea.
*A 'Hammer' candlestick is a term used by technical analysts to describe a specific chart formation. It forms when a share or other instrument falls sharply after the market opens, but ends the day much higher than the low. It looks like a lollipop, or a hammer.
Rajan Dhall is a freelance contributor and not a direct employee of interactive investor.
These articles are provided for information purposes only. Occasionally, an opinion about whether to buy or sell a specific investment may be provided by third parties. The content is not intended to be a personal recommendation to buy or sell any financial instrument or product, or to adopt any investment strategy as it is not provided based on an assessment of your investing knowledge and experience, your financial situation or your investment objectives. The value of your investments, and the income derived from them, may go down as well as up. You may not get back all the money that you invest. The investments referred to in this article may not be suitable for all investors, and if in doubt, an investor should seek advice from a qualified investment adviser.
Full performance can be found on the company or index summary page on the interactive investor website. Simply click on the company's or index name highlighted in the article.