Commodities outlook: When buyers might return to gold and oil
Even gold has plunged as investors dash for cash, but the tide will turn eventually. Might it be here?
20th March 2020 11:37
by Rajan Dhall from interactive investor
Even gold has plunged as investors dash for cash, but the tide will turn eventually. Might it be here?
These are very tough times in the macro markets, and it seems like the scramble for cash is the main theme. Gold is usually the safe-haven asset of choice in uncertain times, but the velocity of the move has been so extreme that investors have been pulling cash from anywhere they can.
Central banks and governments are throwing out cash like its worthless and JP Morgan once said: "Gold Is Money, Everything Else Is Credit". Cutting interest rates and adding to QE does not seem to be having the desired short-term effect. The stock markets are largely ignoring these measures. Eventually, something has to give.
The derivative (paper) gold market is much bigger than the physical one. Futures, options and leasing contracts far outweigh the amount of physical gold in storage at central banks and in vaults etc. This means the recent price drop can be explained by investors and traders looking for cash for margin calls and redemptions.
At some stage, this could come to an end and the physical spot price could push back up again. Timing is obviously the key here. The charts offer a solution to this problem. If any of the key resistance levels are broken, this could indicate buying momentum has returned.
- Stockwatch: Ugly duckling gold miner becoming a swan
- There’s a way to invest in gold via this ii Super 60 recommended fund
- Take control of your retirement planning with our award-winning, low-cost Self-Invested Personal Pension (SIPP)
Volume must also back the move for confirmation - $1,446.2 per ounce is the current wave low support zone. This seems to be holding firm but, if that breaks, then $1,376.5 per ounce is next and, quite frankly, looks slightly more robust.
Above this is where the bulls will be more interested, a break of $1,566.2 per ounce could indicate a move back to the recent $1,707 per ounce wave high. Beyond that, the target must surely be all-time highs of $1,923.7 per ounce. This is all dependant on how bad the coronavirus situation gets of course.
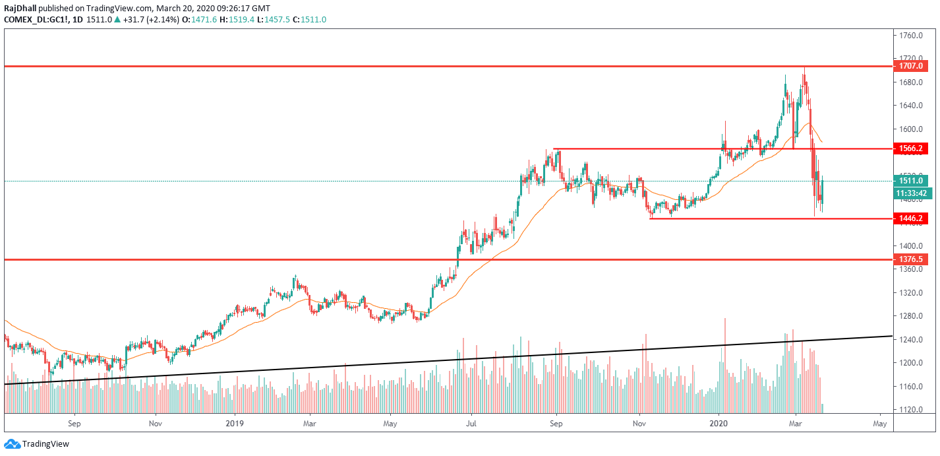
Source: TradingView Past performance is not a guide to future performance
Oil has bounced pretty hard off the lows of $20.52 per barrel this week. Donald Trump has said he will now get involved with the Saudi Arabia-Russia conflict when he thinks it's necessary. The US president will help the smaller oil companies in the US during these tough times and restore the Strategic Petroleum Reserves (SPR) with bulk purchases from producers with less than 5,000 staff.
Just yesterday, WTI oil futures (+23.81%) saw its biggest daily move since data began in March 1983. Brent crude (+14.43%) had its biggest daily move higher since the drone strike on Saudi oil facilities back in September. This caused a massive shadow (wick) on the weekly candle on the chart below. These are usually considered a bullish signal but, in these uncertain times, take them with a pinch of salt.
With the key downside level already broken, many traders will be looking to pick up bargains. The saying "trying to catch a falling knife" comes to mind here. Until the $35.05 per barrel resistance is broken there is not much to be bullish about looking at this chart.
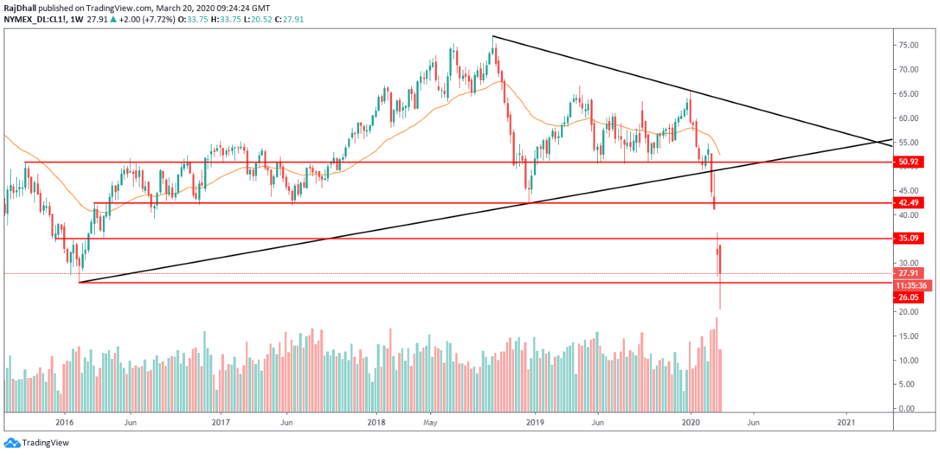
Source: TradingView Past performance is not a guide to future performance
Rajan Dhall is a freelance contributor and not a direct employee of interactive investor.
These articles are provided for information purposes only. Occasionally, an opinion about whether to buy or sell a specific investment may be provided by third parties. The content is not intended to be a personal recommendation to buy or sell any financial instrument or product, or to adopt any investment strategy as it is not provided based on an assessment of your investing knowledge and experience, your financial situation or your investment objectives. The value of your investments, and the income derived from them, may go down as well as up. You may not get back all the money that you invest. The investments referred to in this article may not be suitable for all investors, and if in doubt, an investor should seek advice from a qualified investment adviser.
Full performance can be found on the company or index summary page on the interactive investor website. Simply click on the company's or index name highlighted in the article.