Commodities review of 2019 and outlook for 2020
It’s been a fascinating 12 months for metals and oil traders, and this year promises not to be dull.
2nd January 2020 11:33
by Rajan Dhall from interactive investor
It’s been a fascinating 12 months for metals and oil traders, and this year promises not to be dull.
This year's business has been dominated by the trade war between the US and China and the subsequent slowdown in global growth, and Donald Trump seemed to have found a weapon in his toolbox that worked.
The US has the biggest consumer market in the world and President Trump used taxes on imports into the States as a bargaining chip to get what he wanted from the global community. He did not only target China with tariffs, but also the EU and Iran, slapping extra taxes on cars and other goods.
Copper bottomed
This move led to global uncertainty when it came to international trade. Commodities took a big hit as Chinese growth suffered, causing infrastructure projects to be halted and less demand for copper and other commodities.
On the supply side, there have been issues all year. The political situation in South America in Chile and neighbouring nations deteriorated and the public took to the streets to demonstrate. This led to strikes at Escondida, the world’s biggest mine, and there have been continuous disruptions due to poor conditions.
Mined production fell by 0.5% in the first eight months of this year, according to the latest monthly bulletin from the International Copper Study Group (ICSG). There is a forecast rise in production for 2020, but demand and macroeconomics will continue to steal the show.
- Mining sector stock tips for 2020
- How mining stocks will profit from Tesla Cybertruck and Ford F-150
- Best metals to back in 2020 and stocks to exploit them
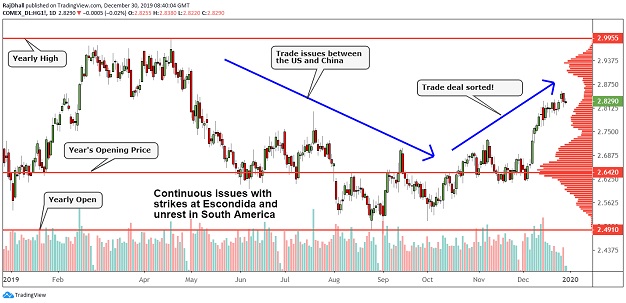
Looking at the copper price chart below, you can see we had a strong finish to 2019. The volume profile indicator shows that on the COMEX exchange most contracts were traded at the opening price of $2.64 per ounce. That level provided lots of action and acted as a magnet for the price throughout the year.
Since the "phase one" deal between the US and China was agreed, the price has moved higher but failed to push to the yearly high of $2.99 per ounce. As we head into election year, Trump may start playing nice with China in a bid to boost his ratings but the psychological $3 per ounce level looks key.
Source: TradingView Past performance is not a guide to future performance
Onwards and upwards for oil
Oil has had its own issues this year. Of course, the market has been affected by the global growth story, but oversupply from the US shale revolution continues to be the dominant theme in the energy markets.
The US has become the world’s largest producer of oil and, unlike the Russian's and Saudi's, their economy does not rely on it. This means they can be stubborn about prices. The US President also likes a lower oil price as it helps his rankings in the polls. He tweeted about OPEC this year, saying they are manipulating the oil price and it may be too high.
Nevertheless, the OPEC+ nations managed to agree a deal to cut production to the end of Q1 2020 by another 500,000 barrels per day. Saudi Arabia had been in a tough situation as they had to get away the IPO of state-owned Saudi Aramco. This meant that they could not cut production too much but also needed a higher oil price.
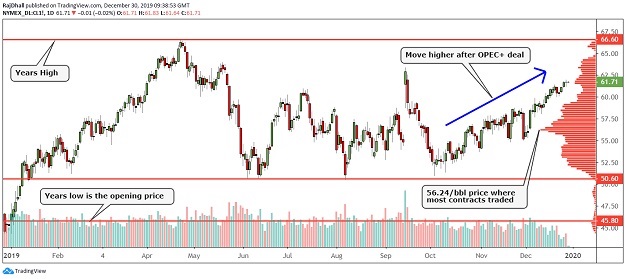
Looking at 2019's price action, and oil started at its low point for the year. The support zone established itself at $50.60 per barrel and the price reached a high of $66.60 per barrel.
Interestingly, the main area of action was at $56.24 per barrel, and this price acted as a great pivot throughout the year. Now that the deal has been arranged, the price has settled above $60 per barrel and into 2020 some energy market commentators have predicted that the growth of shale has reached a plateau. If that is the case, then these levels could be the "new normal" and price moves could be governed by demand once again.
Source: TradingView Past performance is not a guide to future performance
A golden investment for 2020?
Gold has been one of the best stories of the year for me. The price has rocketed amid a flurry of so-called central bank buying. Central banks around the world have been hoarding dollars as a hedge as the price of the US currency kept rising throughout the year.
What makes the bullish move even more interesting is the fact that, in general terms, stocks and the greenback have also risen substantially, although the dollar index has pulled back recently.
At the beginning of the year, the Federal Reserve had been raising interest rates, and this seemed to cap the rise in the price of the precious metal, but, when the Fed announced they were pausing the hiking cycle, the price shot up. Taking risk off the table seems to be a key theme of the year and China is still some way off its targeted gold holdings.
Physical gold holdings look set to rise over the course of the coming years and, if there is to be another stock market crisis, the price could soar to record levels once again.
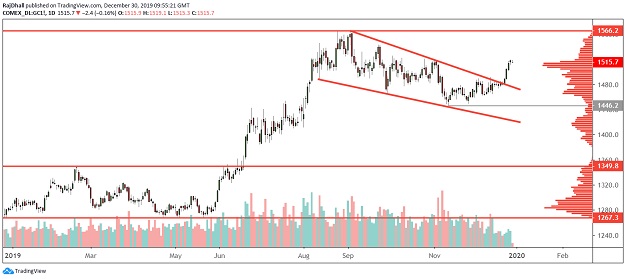
The daily chart below shows the extent of the price rise as the yearly low stands at $1,267.3 per ounce. The amazing part of this chart is the speed of the rally from the aforementioned low to the high on the chart of $1,566.2 per ounce.
Source: TradingView Past performance is not a guide to future performance
Now the price has consolidated and formed a bull flag pattern, which the price has recently broken out of. The key volume area is very close to where we are now, and the price has settledat over $1,500 per ounce.
Moving forward, the resistance level of $1,566.2 per ounce is key. If that level breaks it would be a massive bullish signal, especially on good volume.
Rajan Dhall is a freelance contributor and not a direct employee of interactive investor.
These articles are provided for information purposes only. Occasionally, an opinion about whether to buy or sell a specific investment may be provided by third parties. The content is not intended to be a personal recommendation to buy or sell any financial instrument or product, or to adopt any investment strategy as it is not provided based on an assessment of your investing knowledge and experience, your financial situation or your investment objectives. The value of your investments, and the income derived from them, may go down as well as up. You may not get back all the money that you invest. The investments referred to in this article may not be suitable for all investors, and if in doubt, an investor should seek advice from a qualified investment adviser.
Full performance can be found on the company or index summary page on the interactive investor website. Simply click on the company's or index name highlighted in the article.