Countdown to a big FTSE 100 chart move
After trading a narrow range this summer, then drifting lower, a significant breakout may happen soon.
7th October 2020 14:18
by Lee Wild from interactive investor
After trading a narrow range this summer, then drifting lower, a significant breakout may happen soon.

While the US tech-focused Nasdaq index extended incredible gains this summer, our own FTSE 100 index moved largely sideways. But a quick read of the charts indicates this may be about to change.
Even an amateur technical analyst can draw a line from the pre-pandemic high late February across two other touch points, one in September and the other this month.
An uptrend can also be seen from the March low to touch points last month and again at the beginning of October.
Extend these lines and they meet at the 38% Fibonacci Retracement level (see chart). It sounds complicated, but software packages do the hard work, and Fibonacci levels have proven significant as areas of both support and resistance for share prices, commodities and currencies.

Source: TradingView Daily chart Past performance is not a guide to future performance
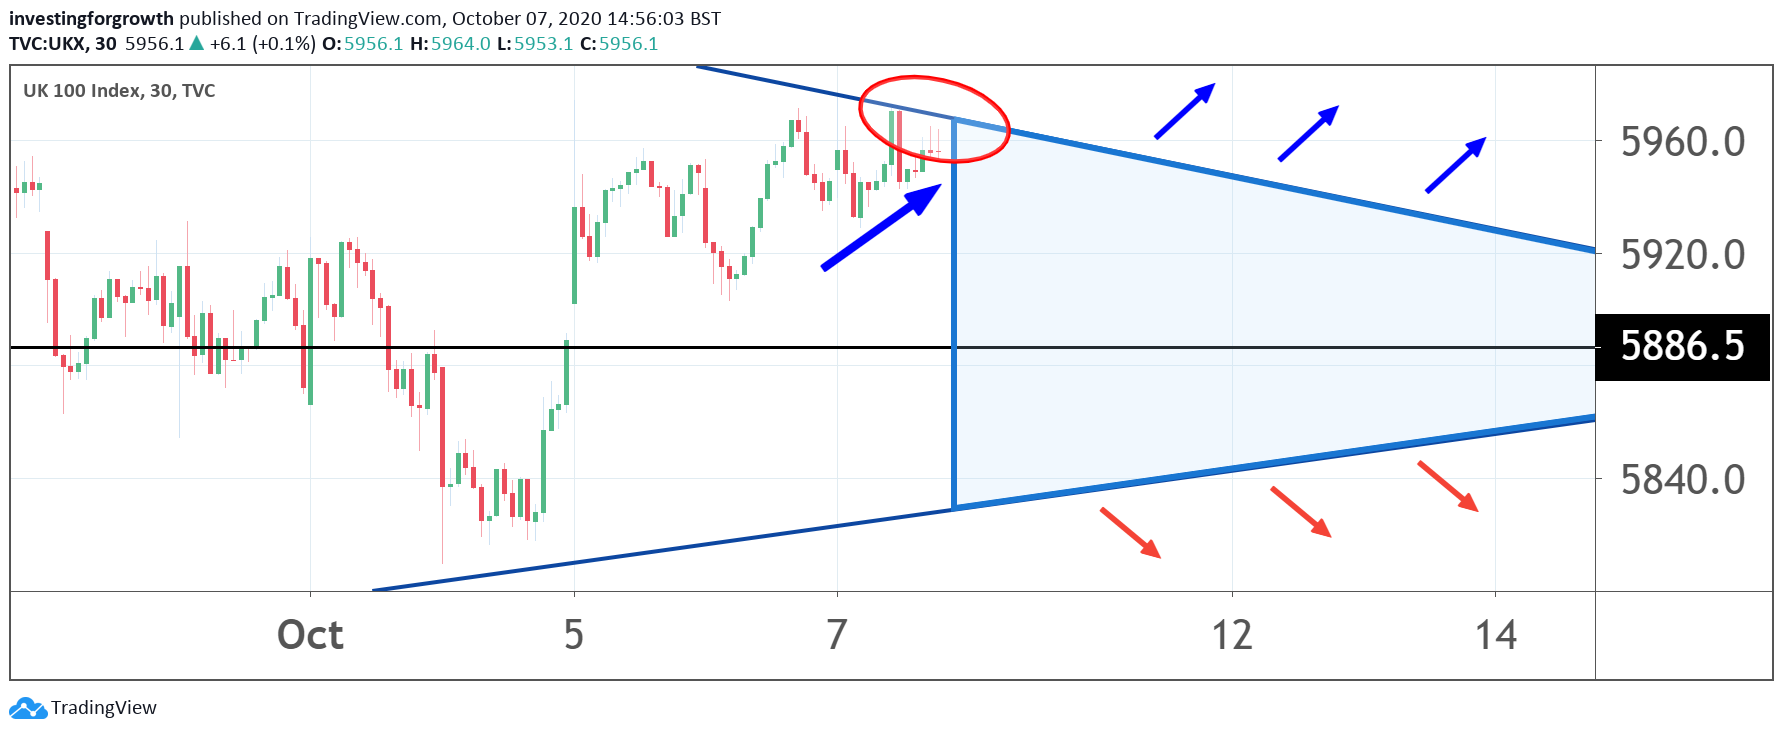
In the 4-hour chart below, the FTSE 100 index is currently pushing up against the downtrend where it is meeting resistance. Previously, it has met resistance when in decline and testing the uptrend.
The blue triangle in the chart is an area where the index could effectively remain ‘trapped’ until buying or selling is strong enough to push the price through either of the trend lines. When this happens, movements can be very swift and significant.

Source: TradingView 4-hour chart Past performance is not a guide to future performance
I remain a fan of charts as an aid to timing entry and exit points for share trades, but I also see value in their significance as indicators of trends and strength of sentiment one way or the other.
This pattern may be nothing, but it might also herald the beginning of a trend in either direction that investors at least ought to be aware of. It could happen today, or some time over the next couple of weeks. If nothing else, it’s a nice trend to track and see if there’s something in it.

Source: TradingView 30-minute chart Past performance is not a guide to future performance
These articles are provided for information purposes only. Occasionally, an opinion about whether to buy or sell a specific investment may be provided by third parties. The content is not intended to be a personal recommendation to buy or sell any financial instrument or product, or to adopt any investment strategy as it is not provided based on an assessment of your investing knowledge and experience, your financial situation or your investment objectives. The value of your investments, and the income derived from them, may go down as well as up. You may not get back all the money that you invest. The investments referred to in this article may not be suitable for all investors, and if in doubt, an investor should seek advice from a qualified investment adviser.
Full performance can be found on the company or index summary page on the interactive investor website. Simply click on the company's or index name highlighted in the article.