easyJet triggers one of the biggest warning bells a share can ring
16th June 2022 07:40
by Alistair Strang from interactive investor
Already trading around multi-year lows, shares in this budget airline remain high risk. Independent analyst Alistair Strang has identified a chart pattern that deserves respect.

Sometimes, it’s worth decluttering your charts in case you’re missing something obvious. Aside from ditching all technical indicators, just change the chart type to “Line”, zoom out and take a five-plus year view, and think about what you’re seeing.
Currently easyJet (LSE:EZJ) provide a perfect example for this stance, albeit not a particularly comfortable example.
- Invest with ii: Top UK Shares | Share Tips & Ideas | Open a Trading Account
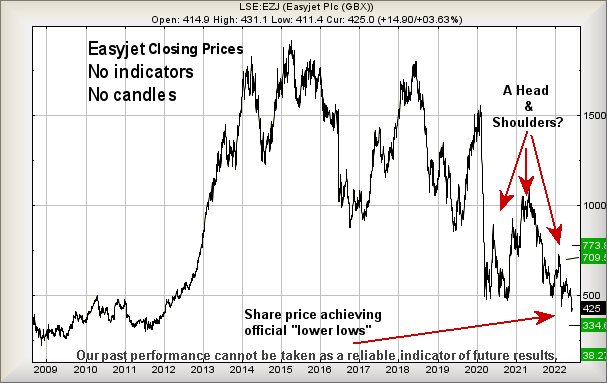
The chart below for EZJ dates back to 2009 and, hopefully obviously, there are a couple of items worthy of consideration. The current narrative among shares is “buy while they’re cheap” but, with easyJet, we’re pretty far from convinced the budget airline is offering a share price which matches their alleged ticket policy.
Past performance is not a guide to future performance.
The first thing which should be noticed is the current share price. By turning off “candles”, it becomes immediately clear the share is achieving “lower lows”, perhaps one of the biggest warning bells a share can ring. The chart below, showing easyJet with “candles” turned on manages to utterly conceal the harsh reality of recent movements.
Secondly, there’s the small matter of a potential that a Head and Shoulders pattern is making itself known. Generally, we ridicule chart patterns but this one is deserving of respect, roughly two-thirds of the time. Since the Covid-19 pandemic low of 2020, it’s possible easyJet has painted this dangerous pattern. To be honest, easyJet are far from alone in describing such a trajectory since the pandemic hit. It’s currently the case Bitcoin appear to be reaping the rewards of a similar trade history.
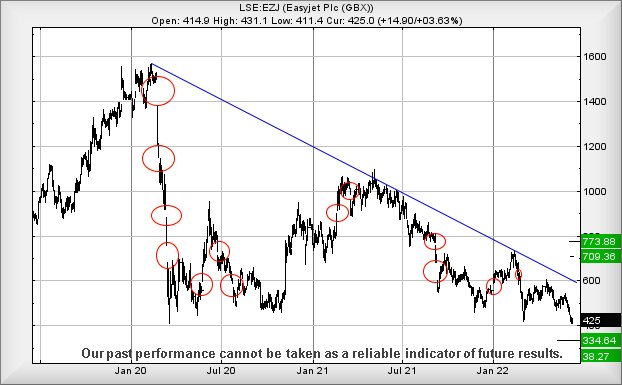
The chart below shows easyJet, this time with candles turned on. Just to add confusion, we’ve chosen to Red circle the major share price manipulation gaps since 2020.
At a glance, it’s obvious the market has chosen to force the share price down. On 10 out of 13 circles, the market has gapped the price downward, almost feeling like there may be a wish to drive easyJet lower.
Past performance is not a guide to future performance.
This being the case, the current situation suggests weakness below 408p risks triggering reversal to 334p next and hopefully a bounce. Below 334p and we’ll start to suspect the effect of the previously mentioned Head & Shoulders formation is kicking into play, our secondary target calculating at a ridiculous looking 38p.
For easyJet to ascend out of trouble, the share price needs exceed Blue on the chart, currently around 600p as this should trigger gains to an initial 709p with secondary, if bettered, at a game changing 773p.
Alistair Strang has led high-profile and "top secret" software projects since the late 1970s and won the original John Logie Baird Award for inventors and innovators. After the financial crash, he wanted to know "how it worked" with a view to mimicking existing trading formulas and predicting what was coming next. His results speak for themselves as he continually refines the methodology.
Alistair Strang is a freelance contributor and not a direct employee of Interactive Investor. All correspondence is with Alistair Strang, who for these purposes is deemed a third-party supplier. Buying, selling and investing in shares is not without risk. Market and company movement will affect your performance and you may get back less than you invest. Neither Alistair Strang or Interactive Investor will be responsible for any losses that may be incurred as a result of following a trading idea.
Disclosure
We use a combination of fundamental and technical analysis in forming our view as to the valuation and prospects of an investment. Where relevant we have set out those particular matters we think are important in the above article, but further detail can be found here.
Please note that our article on this investment should not be considered to be a regular publication.
Details of all recommendations issued by ii during the previous 12-month period can be found here.
ii adheres to a strict code of conduct. Contributors may hold shares or have other interests in companies included in these portfolios, which could create a conflict of interests. Contributors intending to write about any financial instruments in which they have an interest are required to disclose such interest to ii and in the article itself. ii will at all times consider whether such interest impairs the objectivity of the recommendation.
In addition, individuals involved in the production of investment articles are subject to a personal account dealing restriction, which prevents them from placing a transaction in the specified instrument(s) for a period before and for five working days after such publication. This is to avoid personal interests conflicting with the interests of the recipients of those investment articles.