Five trust bargains in a battered and bruised sector
With bombed out valuations this trust sector catches the eye.
18th September 2020 15:01
This content is provided by Kepler Trust Intelligence, an investment trust focused website for private and professional investors. Kepler Trust Intelligence is a third-party supplier and not part of interactive investor. It is provided for information only and does not constitute a personal recommendation.
Material produced by Kepler Trust Intelligence should be considered a marketing communication, and is not independent research.
With bombed out valuations this trust sector catches the eye.

Five small cap trusts on very wide discounts
William Heathcoat Amory, Founder, Kepler Trust Intelligence.
Trusts in the AIC UK Smaller Companies sector have de-rated significantly. Discounts have widened dramatically this year, having been pushed to a historic narrow point by the ‘Boris bounce’ at the end of last year. On an average discount of 12%, discounts in the sector are now wider than the 10 year weighted average discount of 11.5%. Within this average, there are some significant outliers. We look at the prospects for smaller company returns, as well as highlight those trusts exposed to them which are on wide discounts.
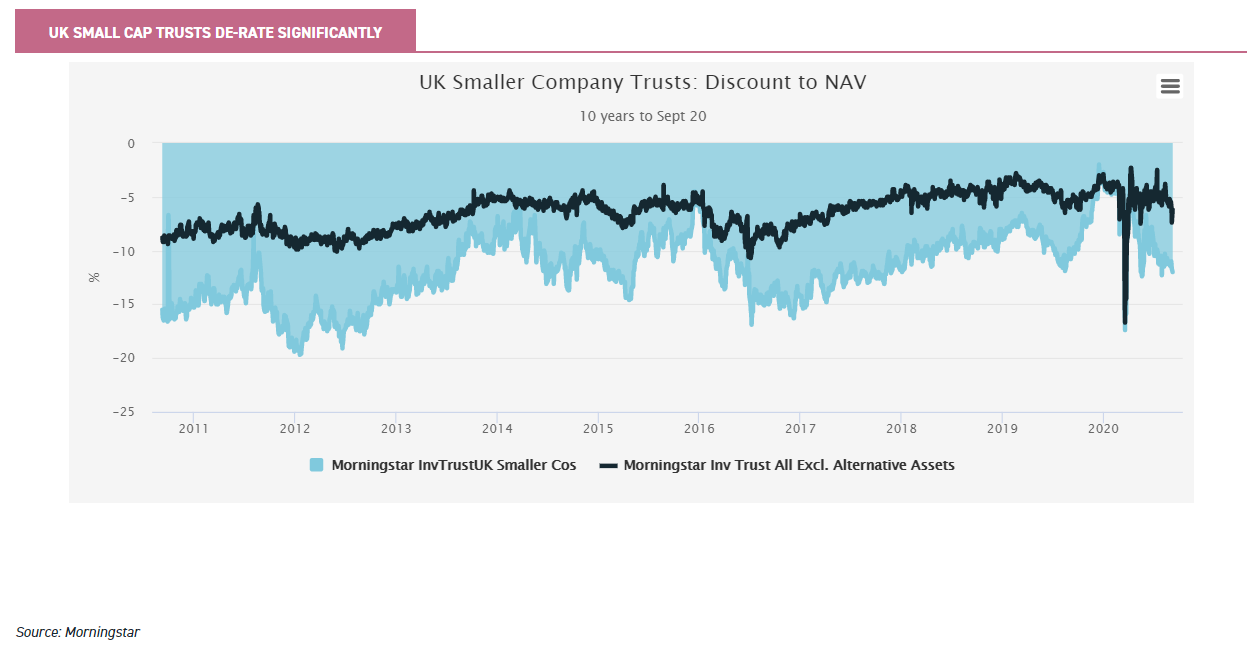
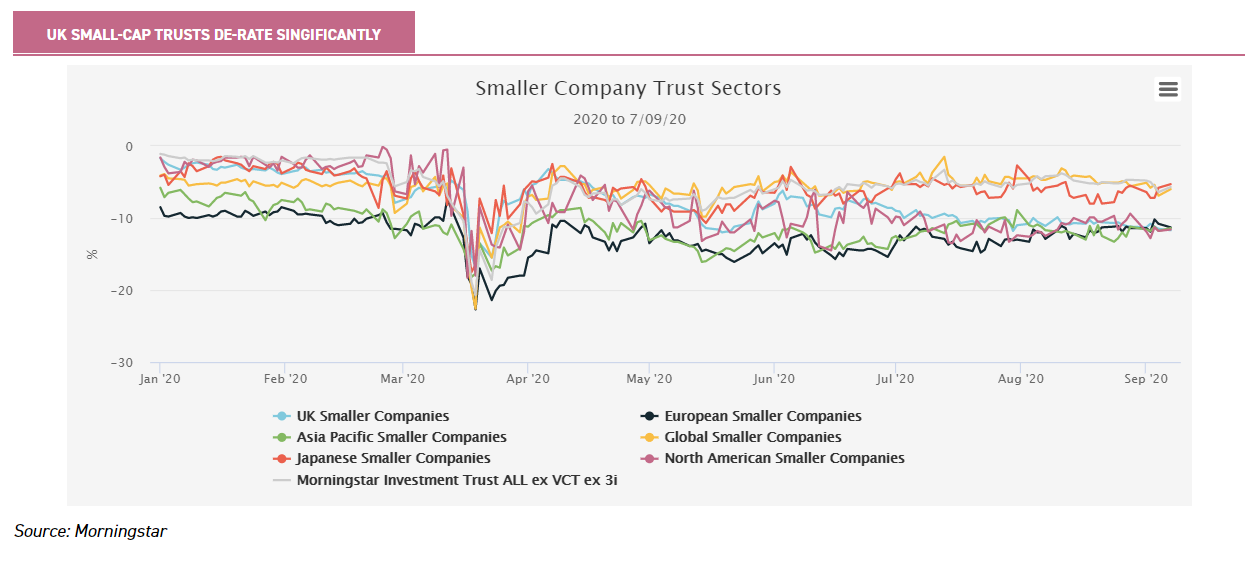
The graph below puts the UK Smaller Companies trust sector de-rating into context. Of all the different smaller company geographic sub-sectors, the derating that the UK Smaller Companies sector has experienced has been most extreme. It was the sub-sector on the narrowest discount at the beginning of the year, and yet, over the space of a few months, has moved to the widest discount.
Is this de-rating justified?
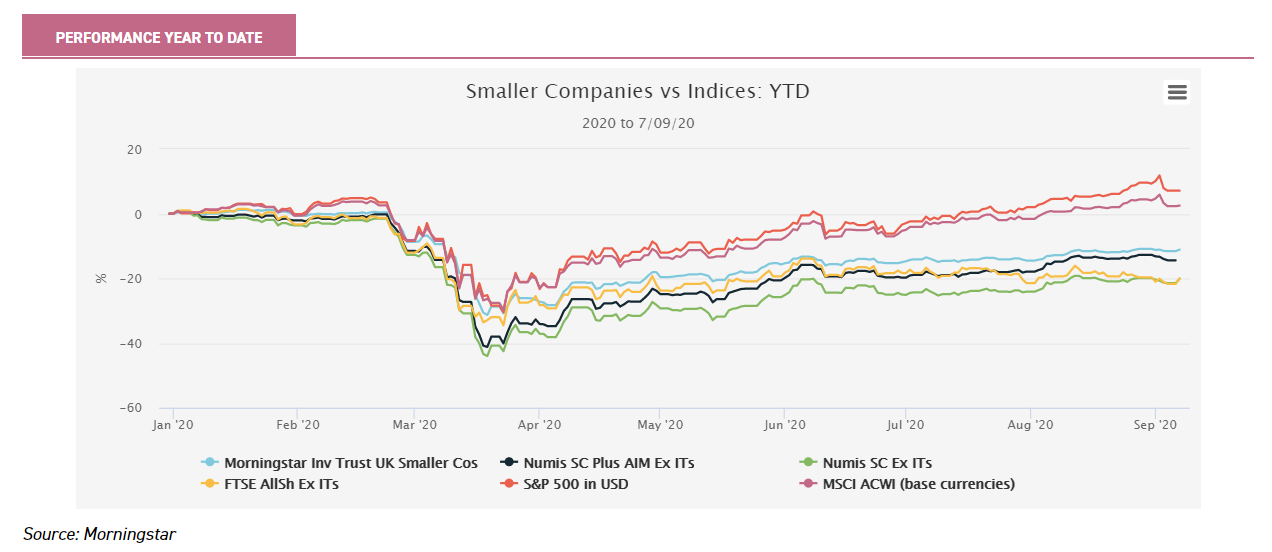
The UK market has certainly underperformed other major stock market indices. However Small Cap trusts fell far less in the initial downturn (in NAV terms) than UK indices, and a similar amount compared to the S&P and the MSCI ACWI in local currency terms. After the rebound the small-cap trusts maintain their lead over UK indices, although these are well behind the local currency performance of the S&P 500 and the MSCI ACWI.
We have also displayed the Numis index, including AIM which some trusts have as their benchmark, in the chart below. We would ascribe the difference between this index and the Numis ex AIM index this year to the AIM ‘mega-caps’, which tend to be more exposed to technology – or more specifically the internet.
In some ways the fact that UK equities, as a whole, have rebounded less strongly than global markets might be considered reassuring. With the US presidential election on the horizon, as well as the heightened tensions between the US and China and the EU and Russia, there is certainly a possibility that Q4 could be increasingly volatile for global equities. When we add a sprinkling of Brexit nerves, it is no surprise that our home market in the UK continues to lag.
However the fact that the UK market has lagged others is not a new phenomenon. Since the Brexit referendum there has been a marked de-rating of UK small caps. The one period where momentum seemed to be getting better was the ‘Boris bounce’ following the 2019 general election.
This apparent enthusiasm appears – for now – misplaced. For international investors, it is fair for them to ask why they should bother with the UK. We don’t propose to answer that question here.
However what is clear is that, by historic standards, the UK offers value. On the other hand unless, or until, our future trading status with Europe and the world is settled, then it is fair to assume that multiples for UK businesses are unlikely to expand.
Equity returns are driven by ratings multiple changes and underlying earnings. With the former ‘on ice’ as a potential source of returns, it is down to fundamentals (ie earnings) to drive returns.
In some ways this is good news for smaller company investors: fundamental company analysis in what is generally regarded as the least efficient end of the stock market should enable managers to deliver alpha.
Indeed, over the long term the managers in the UK Smaller Companies trust sector have delivered a positive alpha of 2.7% per annum in the past ten years.
Recession priced in?
While the initial shock of COVID-19 has receded from markets, in terms of earnings, the full effect on company earnings and the wider economy arguably has yet to be felt.
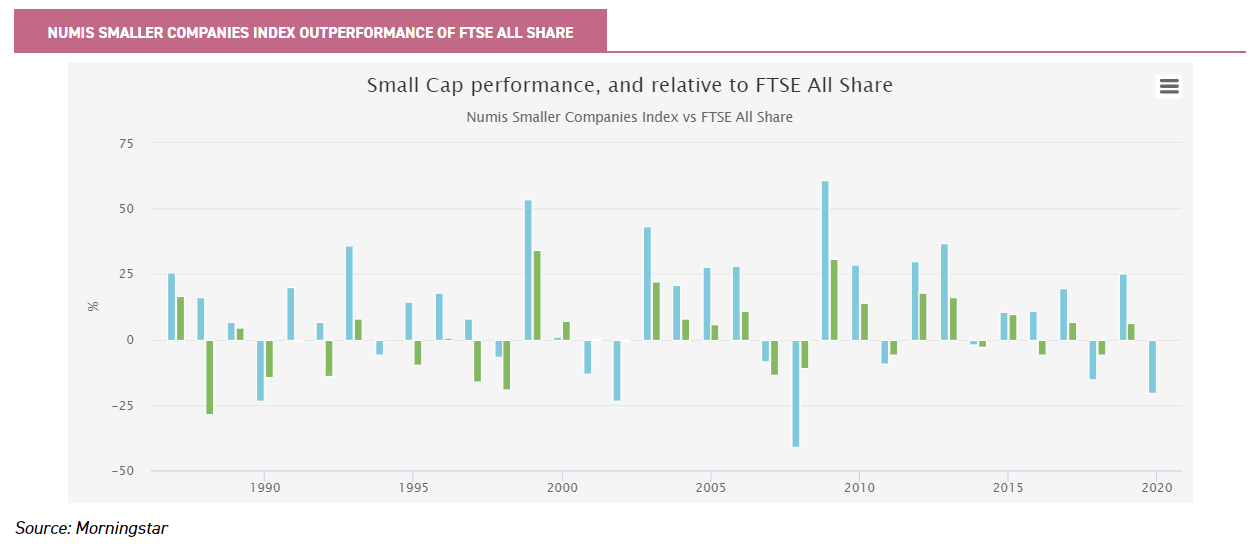
Is the UK headed for recession? Does it matter for small caps? In the graph below we show the small cap market’s performance, as well its out/underperformance of the broader FTSE All Share index.
The average outperformance of small caps over large caps over this time period (since 1987) is 2.1% per annum – on a simple basis, not compounded. However what this graph illustrates well is that in any one year, underperformance and outperformance tends to be quite dramatic.
The major recessions over this period were in 1990 to 1991, and 2008 to 2009. In the first year of a recession – or just the market crashing such as in 2000, which wasn’t technically a recession – small caps underperform and exacerbate stock market falls.
This pattern is clearly repeating itself this year, with 2020 returns year to date lagging wider markets by 20%. However what is interesting is that, in previous periods the subsequent rebound and outperformance is dramatic.
The future is always unknown (and past performance is not a guide to future performance), but the graph does illustrate that buying a big dip in small-cap markets in the past has proven profitable in the rebound.
UK Small Cap trusts well positioned
In this context we believe investors contemplating dipping a toe in the water, would be well served by looking at small-cap investment trusts.
Firstly earning multiples on the underlying portfolios are less stretched than international comparators. Secondly discounts have reverted to historical levels, and in some cases overshot.
Thirdly smaller companies can be more nimble, typically, and have more levers to pull to react to a sudden negative impact on sales. A manager able to sort the wheat from the chaff should be able to add significant alpha at this stage of the cycle, picking the COVID winners and avoiding the losers.
So far this year, as we understand it, part of the problem for small-cap managers during the past two quarters has been that small-cap market leadership in Q1 was led by technology-related names, and conversely the market was led in Q2 by highly cyclical names – as investors realized that government support programmes would minimize bankruptcies.
For low-turnover, fundamental investors this has proven to be a hard few months. However, with the known unknowns now outweighing the unknown unknowns, perhaps the stage is set for stockpickers to come to the fore?
Certainly there might be bumps ahead depending on the Brexit negotiations and how severe the recession proves to be. However, below we highlight some trusts that have seen their discounts widen out significantly, such that their discount Z-scores (a measure of how wide a discount is relative to its own history) are at an extreme level.
Aberforth Smaller Companies Trust (LSE:ASL) owns a portfolio of undervalued companies, which the managers expect to outperform their more expensive peers. The managers are one of the last remaining stalwart value investors left in the trust universe.
As a result the past decade has been tough for them; the last few years have been particularly hard. Nonetheless there have been short windows when the clouds have lifted for the managers.
One such period was in Q4 2019, when ASL delivered a stonking performance relative to peers. The coronavirus crisis has been a cruel blow for shareholders who thought they were finally being rewarded for their patience, after a great bull market for growth over value. However the previous strong performance did show the potential in the portfolio and the diversification that ASL provides.
Although the managers say that they expect to see 50-60% dividend cuts in their market in 2020, ASL has 2.4 times last year’s dividend in reserve.
This means that the board has the firepower to maintain or grow the dividend, should it wish to. On a discount that continues to sag, now at 17.1%, for share price returns, any rebound in NAV performance could be significantly added to by the discount narrowing – the one year average discount (according to JPM Cazenove statistics) is 7.6%.
BlackRock Smaller Companies (LSE:BRSC) is managed by Roland Arnold, and is one of the most diversified in the UK Smaller Companies trust sector with around 130 holdings.
Roland invests in growth companies which have the potential to become market leaders in their fields. The trust also invests much more towards the lower end of the market cap spectrum: with the average market cap of portfolio companies around half that of stablemate BlackRock Throgmorton Trust (LSE:THRG).
Roland became the sole manager in 2019, having been co-manager since 2018. We believe BRSC’s diversified approach to single-stock risk is particularly attractive in the current uncertain environment.
The trust has dramatically outperformed its peers and the benchmark in falling markets over the past decade, and we attribute this partially to its sensible diversification among companies, sectors and economies. However the trust still retains a focus on high-growth companies, which has helped it outperform in many rising markets too.
BRSC performed relatively strongly through the recent market downturn. Given its diversified blend of high-quality growth companies, we think the trust could be in a good position irrespective of whether markets fall or rebound. When we last profiled the trust back in May this year, it was on a discount of 1%. It now trades on a discount of 13.9%.
Invesco Perpetual UK Smaller Companies Trust (LSE:IPU) has also witnessed a rapid discount widening. It now trades on a discount of 19.7%, having been issuing treasury shares at a premium to NAV as recently as January 2020. In our view part of the reason for the wide discount, may be attributed to a market misunderstanding on the board’s intentions with regards to the dividend.
For a number of years IPU has been paying a proportion of the dividend from capital, such that the trust’s dividend yield was significantly higher than peers.
However the uncertainty presented by COVID-19 meant the board initially stated that it believed that continuing to do so would be inappropriate, and that it was targeting a dividend yield of no less than 2% of the 31 January 2021 share price.
However on 23 July 2020 the board updated its dividend policy stating that: it would endeavour to pay a minimum of 15p per share, “with the aim of delivering more predicable dividend levels to shareholders”.
In addition the board stated it will aim to increase dividends year on year, and that it remains their intention that IPU “continues to deliver a competitive yield within the UK Smaller Company investment trust sector”.
In this context, and notwithstanding what has been a difficult period for managers Jonathan Brown and Robin West, the discount widening so dramatically is interesting. The 15p dividend represents a yield of 3.9% at the current share price, significantly higher than the peer group average.
Jonathan and Robin have a valuation-aware investment approach with a preference for high-quality companies, which means that they tend to recycle strong performers into better value opportunities.
Up until this year the trust has achieved six consecutive calendar years of outperforming the benchmark, in both up and down markets. The discount at the current level is an opportunity to access a high-quality management team, with a proven investment approach that has delivered top quartile performance over time and lower volatility than peers.
Downing Strategic Micro-Cap (LSE:DSM) is another trust that trades on a significantly wider discount compared to its own history, but at 24% the discount is also at an extreme in absolute terms. Having traded at a premium to NAV when DSM first IPO’d, the discount became a feature throughout 2019, and then widened materially during the market volatility in 2020.
The board has a stated policy of monitoring the discount, and has undertaken to buy shares back “if the discount widens materially”. However in the most recently released annual report (published on 3 April 2020), the Chairman recognised the unique circumstances which faced equity markets and held back from making share purchases until the full impact of COVID-19 became clear.
Since then the board has made some limited share buybacks, the last being in June 2020 at a discount of around 27%. In our view the board rightly sees the pointlessness of using a significant amount of DSM’s valuable liquidity to try to hold back the tide. But we do note that any further buybacks will be very accretive to continuing shareholders.
DSM has a highly concentrated portfolio of micro-caps, and as a result underlying liquidity of the holdings is something to be aware of. This approach envisages the manager taking strategic stakes of between 3% and 25% in investee companies, and actively influencing the direction of travel for these by engaging with their boards and managers. It has not all been plain sailing, as the NAV performance since launch will attest to.
However, from a balance sheet perspective, DSM is in a very strong position. With 25% of the portfolio now in cash (as at 31/08/2020) and a further 18% invested in a loan, shareholders should be relatively well-protected from any further market volatility.
A potential catalyst for a re-rating could include either one of the significant equity positions being realized for cash in a corporate transaction, at above the current share price, and/or the loan being repaid in part or in full. Neither is necessarily certain, but DSM offers a double discount – reflecting the underlying discount that the portfolio trades relative to the market, and the share price discount – of 64% which has rarely been wider.
Kepler Partners is a third-party supplier and not part of interactive investor. Neither Kepler Partners or interactive investor will be responsible for any losses that may be incurred as a result of a trading idea.
These articles are provided for information purposes only. Occasionally, an opinion about whether to buy or sell a specific investment may be provided by third parties. The content is not intended to be a personal recommendation to buy or sell any financial instrument or product, or to adopt any investment strategy as it is not provided based on an assessment of your investing knowledge and experience, your financial situation or your investment objectives. The value of your investments, and the income derived from them, may go down as well as up. You may not get back all the money that you invest. The investments referred to in this article may not be suitable for all investors, and if in doubt, an investor should seek advice from a qualified investment adviser.
Full performance can be found on the company or index summary page on the interactive investor website. Simply click on the company's or index name highlighted in the article.
Important Information
Kepler Partners is not authorised to make recommendations to Retail Clients. This report is based on factual information only, and is solely for information purposes only and any views contained in it must not be construed as investment or tax advice or a recommendation to buy, sell or take any action in relation to any investment.
This report has been issued by Kepler Partners LLP solely for information purposes only and the views contained in it must not be construed as investment or tax advice or a recommendation to buy, sell or take any action in relation to any investment. If you are unclear about any of the information on this website or its suitability for you, please contact your financial or tax adviser, or an independent financial or tax adviser before making any investment or financial decisions.
The information provided on this website is not intended for distribution to, or use by, any person or entity in any jurisdiction or country where such distribution or use would be contrary to law or regulation or which would subject Kepler Partners LLP to any registration requirement within such jurisdiction or country. Persons who access this information are required to inform themselves and to comply with any such restrictions. In particular, this website is exclusively for non-US Persons. The information in this website is not for distribution to and does not constitute an offer to sell or the solicitation of any offer to buy any securities in the United States of America to or for the benefit of US Persons.
This is a marketing document, should be considered non-independent research and is subject to the rules in COBS 12.3 relating to such research. It has not been prepared in accordance with legal requirements designed to promote the independence of investment research.
No representation or warranty, express or implied, is given by any person as to the accuracy or completeness of the information and no responsibility or liability is accepted for the accuracy or sufficiency of any of the information, for any errors, omissions or misstatements, negligent or otherwise. Any views and opinions, whilst given in good faith, are subject to change without notice.
This is not an official confirmation of terms and is not to be taken as advice to take any action in relation to any investment mentioned herein. Any prices or quotations contained herein are indicative only.
Kepler Partners LLP (including its partners, employees and representatives) or a connected person may have positions in or options on the securities detailed in this report, and may buy, sell or offer to purchase or sell such securities from time to time, but will at all times be subject to restrictions imposed by the firm's internal rules. A copy of the firm's conflict of interest policy is available on request.
Past performance is not necessarily a guide to the future. The value of investments can fall as well as rise and you may get back less than you invested when you decide to sell your investments. It is strongly recommended that Independent financial advice should be taken before entering into any financial transaction.
PLEASE SEE ALSO OUR TERMS AND CONDITIONS
Kepler Partners LLP is a limited liability partnership registered in England and Wales at 9/10 Savile Row, London W1S 3PF with registered number OC334771.
Kepler Partners LLP is authorised and regulated by the Financial Conduct Authority.