FTSE 100 starts 2019 with three-figure dive
2nd January 2019 13:16
by Lee Wild from interactive investor
After another grim start to a calendar year, the blue-chip index has staged a partial recovery, but what's causing the volatility and how should investors react? Lee Wild talks us through the action.

It felt like 2016 all over again early Wednesday, with the FTSE 100 plunging as much as 128 points, or 1.9% inside 30 minutes on the first trading day of 2019. A bounceback – now a common theme during this volatile period – has erased a chunk of the initial deficit, but things could still go either way.
Of course, January 2016 was a horror show for global stockmarkets, the groundwork done months before as investors fretted over the Chinese economy and global growth, then a first Federal Reserve interest rate increase since 2006.
The FTSE 100 ended 2015 at 6,242.30, but traded as low as 6,071 on 4 January 2016 – a one-day decline of 171 points, or 2.7%. It only bottomed on 11 February at 5,499.50 (still the lowest level over the past six years) for a total decline of 743 points, or 11.9%.
But while much has changed, the same threats remain. There will always be concerns around China's economy, long the catalyst behind a surge in global growth. And it's China that's triggered this New Year slump.
Official data out of the country shows manufacturing in contraction territory and at its weakest since the early 2016 stockmarket crash. It's considered significant enough to spook US futures markets which, at midday Wednesday, show the Dow Jones opening 300 points lower.
Problems in China quickly spill over into the mining sector which relies heavily on the country's thirst for natural resources to fuel economic growth. Glencore is down 4.7%, and Anglo American, Antofagasta and BHP each down around 3.8%.
The US rate tightening cycle, unwinding of QE, and president Trump's intervention will also remain critical for years. Now, we have a trade spat thrown into the mix for good measure, Brexit, and any number of banana skins – known, and perhaps yet unknown - waiting in the wings.
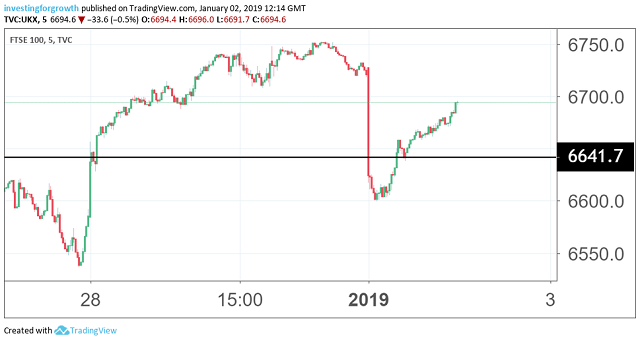
Source: TradingView (*) Past performance is not a guide to future performance
For long-term investors, the sell-offs will provide opportunities. Good quality companies become cheaper, and regularly investing in global equity markets will reap the benefits of pound cost averaging in a down market.
It's never a bad idea to remind ourselves of Warren Buffett's approach in these situations either. Perhaps most relevant right now is this gem:
"During such scary periods, you should never forget two things: First, widespread fear is your friend as an investor, because it serves up bargain purchases. Second, personal fear is your enemy. It will also be unwarranted. Investors who avoid high and unnecessary costs and simply sit for an extended period with a collection of large, conservatively-financed American businesses will almost certainly do well."
The upcoming US fourth-quarter earnings season will be a key test and indicator of which stocks are really worth following.
*Horizontal lines on charts represent levels of previous technical support and resistance. Trendlines are marked in red.
Article - year-end stats (ftse 100, all share, AIM All share dow s&p500 nasdaq and other major indices - see sharepad) plus refer to santa rally pr piece. What was the rally using same criteria?
Article inc December 2018 broke all the rules - meant to be best month of the year (it was the worst - check). No santa rally to speak of although 200 points recovered in final few trading sessions which is in line with historic trends
Oct may have been worst month for ftse 100. WINTER PORTFOLIO write-up - use sharepad portfolio
FTSE 100 had traded as low as 6,673.60 on 6 December before rallying 235 points, or 3.5% over the following week. Those gains were lost, and a flourish in the final few sessions of the year was too little too late.
FTSE 100 fell 5% in October and 4% in February!
In December, the FTSE 100 was actually a star performer compared with the other major indices – but it had done its blood-letting already, and the more modest December decline does not prevent the blue-chip index featuring high up the list of worst index performers in 2018 – down 12.5% - worst year since 2018!
These articles are provided for information purposes only. Occasionally, an opinion about whether to buy or sell a specific investment may be provided by third parties. The content is not intended to be a personal recommendation to buy or sell any financial instrument or product, or to adopt any investment strategy as it is not provided based on an assessment of your investing knowledge and experience, your financial situation or your investment objectives. The value of your investments, and the income derived from them, may go down as well as up. You may not get back all the money that you invest. The investments referred to in this article may not be suitable for all investors, and if in doubt, an investor should seek advice from a qualified investment adviser.
Full performance can be found on the company or index summary page on the interactive investor website. Simply click on the company's or index name highlighted in the article.