FTSE for Friday: this is how low the FTSE 100 could go
30th September 2022 07:17
by Alistair Strang from interactive investor
At the end of a crazy week for financial markets, independent analyst Alistair Strang assesses the odds of further losses and how much further the leading UK index could fall.

This week has been utterly banana’s across the markets, not just the FTSE 100, lots of rises which proved fake and short-lived, some falls which appear uncertain and again, short-lived.
- Read about how to: Open a Trading Account | How to start Trading Stocks | Top UK shares
In an effort to throw some light on potential market directions, we took a look at Thursdays closing prices across a range of global indices. The results proved as illuminating as a worn out toothbrush:
| Index | Thursday Close | Thursday Low | Previous Low | Conclusion | Change % |
| S&P 500 | 3645 | 3610 | 3623 | Lower Low | -0.36 |
| Stoxx 50 | 3273 | 3249 | 3260 | Lower Low | -0.34 |
| UK AIM | 798 | 798 | 799 | Lower Low | -0.13 |
| France | 5676 | 5628 | 5653 | Lower Low | -0.44 |
| Wall St | 29237 | 28997 | 28953 | Higher Low | 0.15 |
| Nasdaq | 11169 | 11038 | 11167 | Lower Low | -1.17 |
| Germany | 11957 | 11866 | 11862 | Higher Low | 0.03 |
| UK FTSE | 6864 | 6829 | 6836 | Lower Low | -0.1 |
As can be seen in the table above, where markets closed Thursday with “Lower Lows”, the resultant percentage wasn’t entirely scary. Equally, on the two indices where the market closed with High Lows, the percentage improvement didn’t exactly set the heather on fire.
About the best we dare conclude from the above is fairly obvious, six out of eight markets achieved Lower Lows with the result we should really suspect some continuance of grotty market conditions.
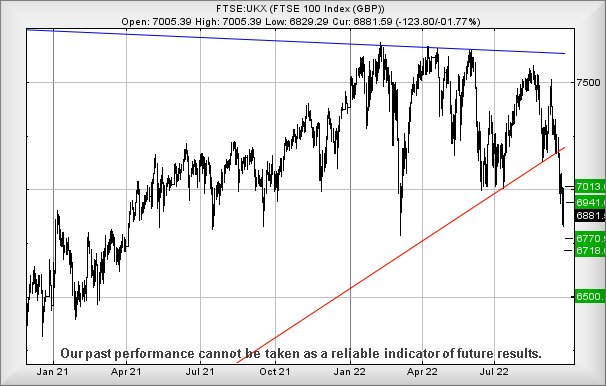
The strange thing is, we’ve been suspecting the UK market shall bottom around 6,750 for some time, and the index is within a nod of achieving such a goal. To be honest, this suspected “bottom” is now being adjusted upward to around 6,783 points, thanks to the utterly insane market swings experienced in the last couple of sessions. But making matters worse, these insane swings also introduce a Plus or Minus 20 points against this potential bottom!
- Six shares where City brokers predict a profits boom
- Why agony may not be over for battered British pound
There’s another question we’d like to skip neatly past, but what happens if our original 6,750 level breaks?
It feels like the FTSE 100 shall continue to enjoy inflicting misery on traders as we expect a real bottom to make itself known at 6,500 points. It’s perhaps worth remembering that on a daily basis we scan many shares, and this week has seen a truly excessive number of UK stocks triggering downward movements.

Past performance is not a guide to future performance
From a near-term perspective, the FTSE apparently requires to exceed 6,917 points to trigger the potential of surprise recovery to an initial 6,941 points. If bettered, our secondary calculation comes in at a more encouraging 7,013 points.
The converse picture is less happy as below 6,829 works out with reversal potentials to an initial 6,770 with secondary, if broken, at 6,718, taking the index into a region where a bottom around 6,500 starts to look extremely probable.
To eradicate all this misery, the UK index needs a miracle above 7,179 points, something which currently looks quite impossible.
Have a good weekend.
Alistair Strang has led high-profile and "top secret" software projects since the late 1970s and won the original John Logie Baird Award for inventors and innovators. After the financial crash, he wanted to know "how it worked" with a view to mimicking existing trading formulas and predicting what was coming next. His results speak for themselves as he continually refines the methodology.
Alistair Strang is a freelance contributor and not a direct employee of Interactive Investor. All correspondence is with Alistair Strang, who for these purposes is deemed a third-party supplier. Buying, selling and investing in shares is not without risk. Market and company movement will affect your performance and you may get back less than you invest. Neither Alistair Strang or Interactive Investor will be responsible for any losses that may be incurred as a result of following a trading idea.
These articles are provided for information purposes only. Occasionally, an opinion about whether to buy or sell a specific investment may be provided by third parties. The content is not intended to be a personal recommendation to buy or sell any financial instrument or product, or to adopt any investment strategy as it is not provided based on an assessment of your investing knowledge and experience, your financial situation or your investment objectives. The value of your investments, and the income derived from them, may go down as well as up. You may not get back all the money that you invest. The investments referred to in this article may not be suitable for all investors, and if in doubt, an investor should seek advice from a qualified investment adviser.
Full performance can be found on the company or index summary page on the interactive investor website. Simply click on the company's or index name highlighted in the article.