The gold price and its upside potential
After last year’s rally in the yellow metal unexpectedly met his price target, independent analyst Alistair Strang has run his software to generate new objectives.
4th June 2025 10:54
by Alistair Strang from Trends and Targets

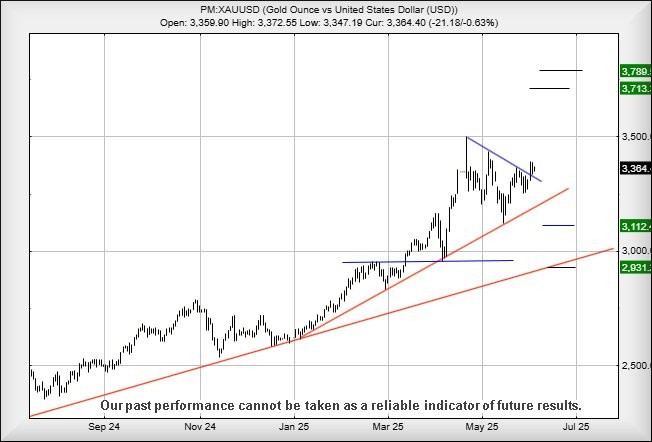
This one is difficult. Once upon a time, we gave a target for gold at $2,800 an ounce, not expecting such a level to be exceeded. Last year, on 31 October, the metal bubbled up to our target level, it immediately retreated, thus proving (thankfully) we’d been watching the correct trend.
Unfortunately, the market was only willing to feed us three months of feeling smug, then the price of gold boldly moved above $2,800 at the start of February this year. It was now wandering into an area where we’d to admit we were clueless.
- Invest with ii:Open a Stocks & Shares ISA | Top ISA Funds | Transfer your ISA to ii
Quite genuinely, we’ve been forced to remain fairly silent on gold until it becomes clear the market actually knows what it’s doing. But when we look back in time to 2002, we’ve discovered a trail of logic which allows for further growth in the price of the precious metal.
Apparently, we are now to believe market closure above just $3,400 should trigger gains in the direction of an initial $3,713 with our secondary, if bettered, calculating at $3,780.
We’re a little interested in these target levels, the close proximity suggesting a further price ceiling awaits. At present, we cannot calculate anything above $3,780, effectively expecting a repeat of what happened at our $2,800 level. Over the years, this sort of thing has happened, when an object such as an index goes above a particular target level.
For instance, when the Dow Jones went above 36,000, it became a problem with dodgy calculations pointing at a future 45,000 as becoming a special target level of interest.
The index has now brushed against this level twice, being forced to retreat each time, now giving the potential of reversals to 35,000 and perhaps a bounce. But should 35,000 break, all hell risks breaking loose.
And should the price of gold intend to go wrong, it now needs melt below $3,200 as this risks triggering reversals to $3,112 with our secondary, if broken, at $2,931. But for now, we think gold intends bubble up toward the high $3,700 level.
Source: Trends and Targets. Past performance is not a guide to future performance.
Alistair Strang has led high-profile and "top secret" software projects since the late 1970s and won the original John Logie Baird Award for inventors and innovators. After the financial crash, he wanted to know "how it worked" with a view to mimicking existing trading formulas and predicting what was coming next. His results speak for themselves as he continually refines the methodology.
Alistair Strang is a freelance contributor and not a direct employee of Interactive Investor. All correspondence is with Alistair Strang, who for these purposes is deemed a third-party supplier. Buying, selling and investing in shares is not without risk. Market and company movement will affect your performance and you may get back less than you invest. Neither Alistair Strang or Interactive Investor will be responsible for any losses that may be incurred as a result of following a trading idea.
These articles are provided for information purposes only. Occasionally, an opinion about whether to buy or sell a specific investment may be provided by third parties. The content is not intended to be a personal recommendation to buy or sell any financial instrument or product, or to adopt any investment strategy as it is not provided based on an assessment of your investing knowledge and experience, your financial situation or your investment objectives. The value of your investments, and the income derived from them, may go down as well as up. You may not get back all the money that you invest. The investments referred to in this article may not be suitable for all investors, and if in doubt, an investor should seek advice from a qualified investment adviser.
Full performance can be found on the company or index summary page on the interactive investor website. Simply click on the company's or index name highlighted in the article.