Here's what Sky and Compass results say to us
26th July 2018 13:58
by Lee Wild from interactive investor
Sky is caught in a complicated takeover situation, while Compass shares have been in demand recently. Lee Wild, head of equity strategy at interactive investor, explains what latest results mean for both.

Sky
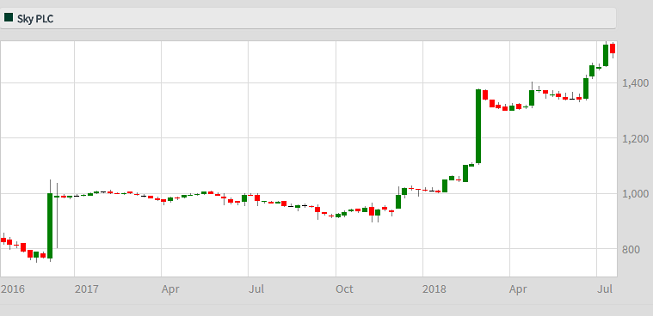
Sky proved today just why Fox and Comcast are fighting tooth and nail for control of the satellite broadcaster. It grew like-for-like revenue by 5% in the past 12 months, cut operating costs and generated double-digit growth in annual profit.
Sky's American suitors will also be encouraged by a 39% increase in customer numbers during the fourth quarter and significant decline in customer churn.
These numbers and a bullish plan for further aggressive growth in the current financial year are clearly presented to squeeze the maximum from potential buyers. It could work.

Source: interactive investor Past performance is not a guide to future performance
Compass Group
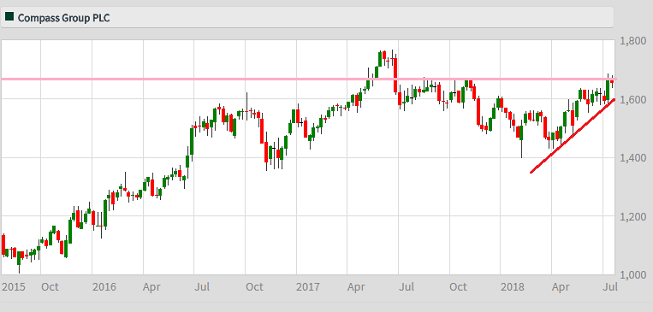
It's been a difficult year for Compass after losing chief executive Richard Cousins in a tragic plane accident, then hearing this month that finance boss Johnny Thomson is off to pastures new. But that Compass shares trade near a record high following an uncharacteristically poor winter performance is testament to the strength of the underlying business.
A drop in first-half profit was disappointing, but both the top line and margins have continued to grow during the third quarter, and Compass shouldn’t have any problems hitting its full-year target given we're just a couple of months from year-end.
There are some issues in the UK around volume and cost, but weaker margin there is being offset by forecast-busting numbers elsewhere and rapid growth in the US. Organic revenue for the quarter grew by 5.7%, or 5.1% excluding Easter, better than the first half and toward the right end of the 4-6% target range.
Compass has always promised to return surplus cash to shareholders and, depending on profit and cash flow, there a very real possibility it will pay another special dividend within the next 12 months.

Source: interactive investor Past performance is not a guide to future performance
These articles are provided for information purposes only. Occasionally, an opinion about whether to buy or sell a specific investment may be provided by third parties. The content is not intended to be a personal recommendation to buy or sell any financial instrument or product, or to adopt any investment strategy as it is not provided based on an assessment of your investing knowledge and experience, your financial situation or your investment objectives. The value of your investments, and the income derived from them, may go down as well as up. You may not get back all the money that you invest. The investments referred to in this article may not be suitable for all investors, and if in doubt, an investor should seek advice from a qualified investment adviser.
Full performance can be found on the company or index summary page on the interactive investor website. Simply click on the company's or index name highlighted in the article.