How to be a better investor: lesson 2
These are the key numbers to look for, useful info in the annual report and best valuation metrics.
24th March 2021 18:10
by Julian Hofmann from interactive investor
In the second of a six-part series of articles, investment expert Julian Hofmann discusses how to do balance sheet analysis. He identifies the key numbers to look for, what information in the annual report will be most useful to you and talks through the various valuation metrics.
There is no getting away from the fact that understanding the numbers that companies report is one of the key due diligence skills that investors need to master. Making this information relevant in an investment context also means understanding the ratios that investors use that quantify the financial health of a company.
Discover more lessons on how to be a better investor here
What is a balance sheet and why is it important?
The holy trinity of reported numbers is the cash flow statement, the income statement, and the balance sheet. However, without a doubt, the most important skill is understanding the underlying state of the balance sheet, as this requires subtle interpretation and analysis.
The balance sheet, simply put, is a snapshot of what a company owns, balanced against what it owes at a particular point in time. If all is well, then a company’s total assets, debt and shareholder equity will balance each other off.
Remember that total shareholder value is only calculated after all liabilities have been paid.
What is a strong balance sheet?
The simplest way to assess this is to take a big blue-chip company and assess why the balance sheet is strong. In the example below we have AstraZeneca’s (LSE:AZN) balance sheet at 31st December 2020 as set out in the 2020 annual report. Pharmaceutical companies are much beloved of income investors and are considered defensive stocks, throwing out dividends come rain or shine.
Using the annual report as a reference is important as it represents the definitively audited accounts.
If we look at the balance sheet below (Fig: 1) a very important number to look at is net current assets – simply put, this is working capital the business has generated after covering the total of its short-term liabilities. In Astra’s case, after meeting short-term liabilities of £1.7 billion, it has cash at hand of over £5.3 billion.
The amount and origin of debt is also important in measuring balance sheet health. The annual report will have a breakdown of when these liabilities fall due. While only a basic summary, you can still infer the debt position and make an educated assessment of how well, or not, the company is managing its balance sheet.
Managing debt
In our example below, Astra has short-term liabilities – those falling within one year – of £1.7 billion, with total borrowings of £17 billion. From this we can deduce that AstraZeneca’s treasury department (an important but often overlooked part of corporate operations) is doing a textbook job by having no more than 10% of debt repayments falling due within one year. Bond market obsessives will recognise this as a type of “ladder portfolio.” The fact that these repayments only consume around a third of its free-cash flow tells you that the company throws off the cash needed to pay both its debts to creditors and dividends to shareholders.
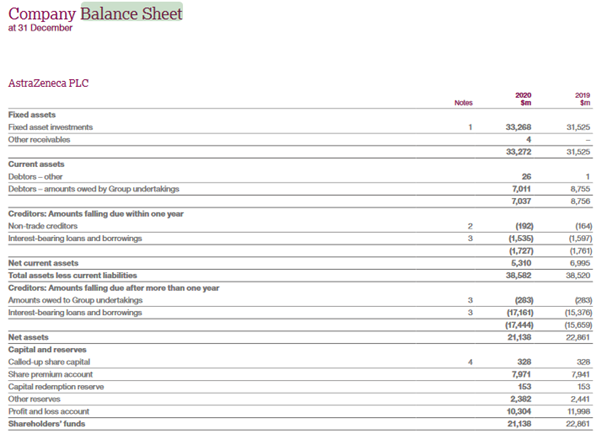
Fig 1: AstraZeneca 2020 annual report
Useful balance sheet ratios
There are a few useful ratios that will help to express the financial position. Debt/shareholder equity tells you how highly geared the balance sheet is. In our example, it would be £17.4 billion/£21.1 billion, or 82%, in other words the balance sheet has a relatively low gearing as assets comfortably outweigh liabilities. It shows that Astra can rely on equity and its own cash flows to fund its day-to-day activities.
The current ratio is a useful snapshot ratio which looks at current assets/current liabilities, in Astra’s case this would be £38 billion /£17.4 billion = 2.2.
Anything above 1.5 indicates a highly cash generative business. This ratio shows Astra to be in rude financial health. By contrast, any number below 0.8 would indicate a business heavily reliant on debt alone to fund its day-to-day activities.
How balance sheets are manipulated
Being able to trust financial accounts is one of the fundamental principles of sound investing. One of the many questions raised by the 2008 financial crisis was why so many of the biggest auditing firms in the world were caught out when banks and other businesses failed, despite their accounts being given a clean bill of health?
While reforms have been enacted, the question over whether investors can take the reported accounts as read is still a live issue. My view on this is that, unless you have access to detailed inventory records, or spreadsheet files containing tens of thousands of transactions, your only option is to trust that the auditors have done their job. However, it is still worth asking whether in the modern economy a disconnect is emerging between the reported accounts and their relevance to investment decision-making.
The intangible issue
One of the most controversial topics in accounting, at the moment, (please bear with me on this one!) is how companies charge the costs of their intangible assets to the balance sheet.
Intangible assets - unlike tangible assets such as factories, machinery or property - covers the investments that companies make that have intangible benefits – managing corporate reputation, investing in a brand, developing new and untried technology, offering new services.
The dollar amount of reported intangible assets has exploded in the past decade. PWC reports that S&P 500 companies reported $26.6 trillion of intangible assets in 2019, compared with only $7.5 trillion in 2009.
The reason for this is the inexorable rise of new technology companies, who not only tend to have few tangible assets, but also generate internally-created intangible assets through their marketing or R&D activities.
This creates problems for investors when assessing the balance sheet.
Essentially, the way intangibles are booked means that their impact on the accounts can only be observed with a time lag – through better future profit margins, for instance – so management’s accountability for intangible investment decisions is somewhat lacking. This is because the value of these investments, as reported, is only the cost of making them, with periodic revaluations. Basically, they are worth what management says they are worth, which could potentially cause trouble if they end up being written off.
At the same time, the door is open to manipulation. Commentators have pointed out that the current method of booking intangibles to the balance sheet could lead unscrupulous managers to cut R&D spending (thereby reducing a company’s real value) because this would cause reported earnings to rise immediately by the same amount, thus triggering those performance bonuses.
These articles are provided for information purposes only. Occasionally, an opinion about whether to buy or sell a specific investment may be provided by third parties. The content is not intended to be a personal recommendation to buy or sell any financial instrument or product, or to adopt any investment strategy as it is not provided based on an assessment of your investing knowledge and experience, your financial situation or your investment objectives. The value of your investments, and the income derived from them, may go down as well as up. You may not get back all the money that you invest. The investments referred to in this article may not be suitable for all investors, and if in doubt, an investor should seek advice from a qualified investment adviser.
Full performance can be found on the company or index summary page on the interactive investor website. Simply click on the company's or index name highlighted in the article.