ii Private Investor Performance Index: Q3 2023
Bonds are added to the ii index as investors go hunting for yields, while active global funds still take top spot.
12th October 2023 09:29
by Jemma Jackson from interactive investor

- Two gilts broke into the top 10 most-held investments among customers aged 25-34 and 35-44 in Q3 2023: TN25 and TN24
- Portfolio weightings to bonds have also crept higher. Customers with allocations to instruments in the ‘other’ category (meaning fixed income and corporate bonds) was just 0.6% in Q4 2020, increasing to 2% in Q3 2023
Now with almost four years of data, interactive investor, the UK’s second-largest investment platform for private investors, has published its latest Private Investor Performance Index* to 30 September 2023.
- Our Services: SIPP Account | Stocks & Shares ISA | See all Investment Accounts
The index has chartered some extraordinary highs and lows in both bond and equity markets, and it shows, with some subtle but significant shifts in customer behaviour.
The average ii customer is up 8.2% since 1 January 2020, lagging the major indices, but slightly ahead of professional fund managers as measured by the IA Mixed Investment 40-85% Shares sector, up 7.7%. Women have outperformed men by one percentage point, not insubstantial in a lower growth environment.
There’s been some strong double-digit returns over the past three years, with the average customer up 18.2%, well ahead of professional managers as measured by the IA Mixed Investment 40-85% sector, up 10.3%.
During the leaner year to date, portfolios have eked out returns of 2.8%, which has also been slightly ahead of the IA Mixed Investment 40-85% Shares sector, up 2.2%.
During periods of volatility, many have been alert to potential opportunities, and not just in bond markets. Phoenix Group Holdings (LSE:PHNX) joined the top 10 traded shares in both volume and popularity in Q3 for the first time, as declining share price and rising yield potentially piqued interest.
Richard Wilson, CEO, interactive investor, says: “Our private investor performance index continues to be the only barometer of its kind to truly take the temperature of how retail investors are faring in these extraordinary times.
“In an ever-changing world, customers are sticking with solid long-term strategies, avoiding knee-jerk reactions, and patently building long term wealth. But they are also open to potential new opportunities, with bonds looking more interesting as yields have risen. We continue to publish content to help customers navigate this asset class and assess the risks.
“Customers continue to embrace active and passive strategies using a combination of funds, investment trusts and ETFs, while also looking to UK and US shares. With the same great value £3.99 trading fee across the spectrum, our customers have a broad range of tools to navigate an uncertain world.”
Cumulative returns since 1 Jan 2020 - End Sept 2023 | 3 years | 2 years | 1 year | 9 months (YTD) | 6 months | 3 months | |
Average ii customer (ii performance index methodology) | 8.2% | 18.2% | -2.9% | 7.9% | 2.8% | 0.6% | 0.8% |
18 - 24 | 10.3% | 12.6% | -6.1% | 6.4% | 2.6% | 1.0% | 0.7% |
25 - 34 | 10.6% | 14.3% | -4.8% | 7.0% | 3.2% | 1.1% | 0.6% |
35 - 44 | 10.7% | 15.4% | -3.3% | 7.1% | 3.9% | 1.2% | 0.6% |
45 - 54 | 9.3% | 16.4% | -3.6% | 7.4% | 3.3% | 0.9% | 0.6% |
55 - 64 | 7.6% | 17.1% | -3.6% | 7.5% | 2.6% | 0.5% | 0.7% |
65+ | 7.6% | 20.6% | -1.8% | 8.7% | 2.4% | 0.3% | 0.9% |
Female | 8.8% | 18.5% | -2.0% | 8.0% | 2.7% | 0.6% | 0.8% |
Male | 7.8% | 18.2% | -3.3% | 7.9% | 2.9% | 0.6% | 0.8% |
IA Mixed Investment 40-85% Shares (GBP) | 7.72 | 10.30 | -5.54 | 5.27 | 2.21 | -0.04 | -0.21 |
FTSE 100 (GBP) | 15.72 | 45.04 | 15.70 | 14.66 | 5.50 | 1.88 | 2.19 |
FTSE All Shares (GBP) | 11.93 | 39.78 | 9.29 | 13.84 | 4.54 | 1.42 | 1.88 |
FTSE World (GBP) | 40.06 | 34.93 | 8.82 | 12.19 | 9.62 | 4.59 | 0.68 |
S&P 500 (GBP) | 53.14 | 41.56 | 13.56 | 11.23 | 11.43 | 6.55 | 0.75 |
S&P 500 (USD) | 41.09 | 33.65 | 2.80 | 21.62 | 13.07 | 5.18 | -3.27 |
Source: Index performance: Morningstar Total Returns (Base Currencies) to 30 September 2023. ii customer returns source, with income reinvested: ii. Past performance is not a guide to the future.
Dominant themes
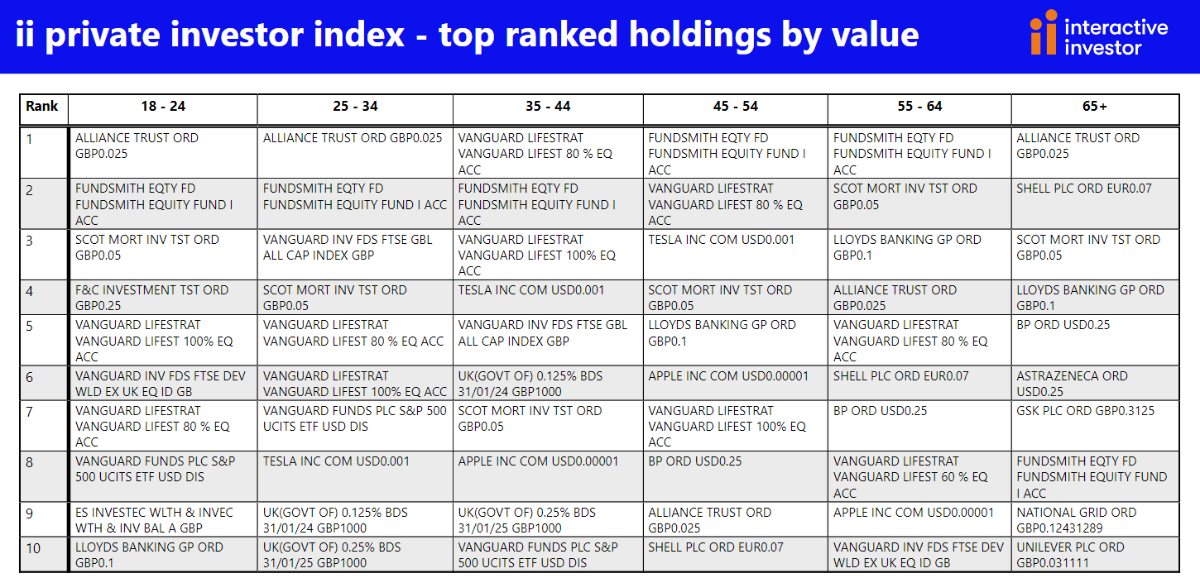
When ii first published this index, Scottish Mortgage (LSE:SMT) Investment Trust was the most-held stock by value among all age groups apart from 18-24 year olds, where it was in second place. After significant share price falls, its highest ranking is currently second place among 55-64 year olds, although it remains in the top 10 across all age ranges.
Active managers still dominate the top spot across the age ranges in the form of Alliance Trust (LSE:ATST), which is currently enjoying a period of strong performance, and Fundsmith Equity. Vanguard LifeStrategy 80% Equity, which invests in passive instruments, is the exception, being the most held fund in the 35-44 age range.
Vanguard funds are tending to dominate the top 10 in every single age category apart from the 65+, where investors prefer a combination of active funds, investment trusts, and FTSE 100 dividend payers.
Interestingly, ii’s youngest and oldest customers in the 18-24 and 65+ age categories eschew the big US tech brands, while Tesla Inc (NASDAQ:TSLA) and Apple Inc (NASDAQ:AAPL) pepper the most held stocks amongst 25-64 year olds.
Bonds make the index as times change
An emerging theme from this instalment is the rise in popularity of bonds, following the recent surge in bond yields on expectations that interest rates will stay higher for longer. This has, of course, come at a cost to existing bond holders, as higher yields have an inverse relationship with bond prices.
But as investors attempt to snap up attractive yields on fixed income, two gilts broke into the top 10 most-held investments among customers aged 25-34 and 35-44 in Q3 2023: UNITED KINGDOM 0.25 31/01/2025 (LSE:TN25) and UNITED KINGDOM 0.125 31/01/2024 (LSE:TN24). Portfolio weightings to bonds have also crept higher. Customers with allocations to instruments in the ‘other’ category (meaning fixed income and corporate bonds) was just 0.6% in Q1 2021, 0.8% in Q4 2022, increasing to 2% in Q3 2023.
Sam Benstead, Bonds Specialist, interactive investor, says: “While rising interest rates are punishing borrowers, some investors are taking advantage by moving money into the bond market, where they are finally being rewarded with attractive yields – with gilts, where the risk of default is effectively zero, now paying between 4.5% and 5% a year. Gilts come with the added bonus of being capital gains tax free, which has boosted the appeal of low coupon bonds set to mature soon, where the vast majority on the total return comes from capital appreciation when the bonds mature.
“Bonds higher up the risk spectrum, including investment grade and high-yield corporate bonds, yield even more. Nevertheless, bonds are not risk-free. While the income from gilts and the return of their principal is secure, their prices can still be volatile, particularly those with a long time before maturity. Investors reprice bonds based on their expectations for interest rates and inflation, so an unexpected rise in interest rate expectations can spook the bond market, sending prices down and yields higher.”
ETF holding creeps higher
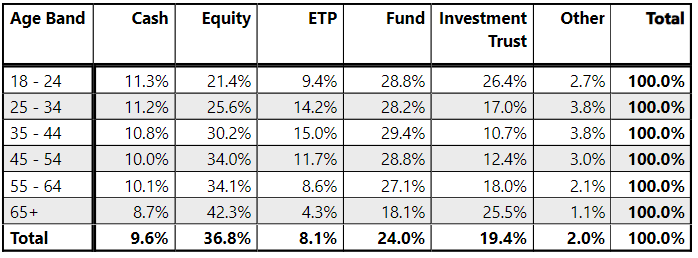
A notable increase in exposure to ETFs has been a recent trend which continued across all age groups in Q3, now accounting for 8.1% of overall customer portfolios, up from 6% in Q4 2020. Passive investments (including funds investing in passive strategies), more broadly, remains popular particularly among young cohorts. Four passive funds appear in the top 10 most-held list of investment among the 18-24, 25-34 and 35-44 age groups. – all of which are from the Vanguard’s stable.
Holdings matter
Looking at data to 30 September 2023, the oldest aged 65-plus cohort posted the best three-year return (up 20.6%), two year (-1.8%), one-year returns (up 8.7%), and three-month returns (up 0.9%), but performed worst over the longest time frame (3 years 9 months).
This cohort has the highest direct equity exposure and the lowest exposure to cash and bonds, illustrating how different strategies can work in different market environments. They also have higher than average exposure to investment trusts (second only to the 18-24 cohort), which have shown their strengths in a more favourable market environment and where the sectors enviable dividend track record may be a factor.
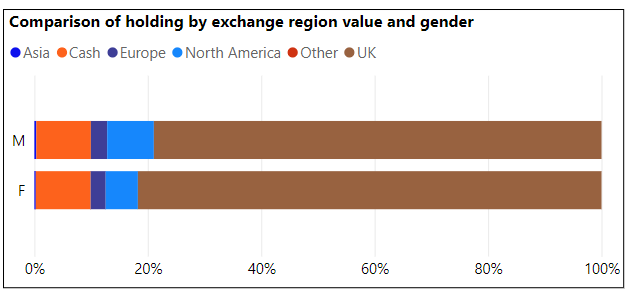
Direct equities – regional exposure
Gender performance comparisons
ii’s female customers continue to outperform since the start of the index in January 2023, up 8.8% versus 7.8% for men in median terms (to 30 September 2023). The one percentage point lead by women continues over a two-year period to 30 September 2023 - although returns are in the negative for both cohorts (-2% for women versus -3.3% for men).
But there isn’t much between the sexes performance-wise over the year to date, with men up 2.9% and women up 2.7%.
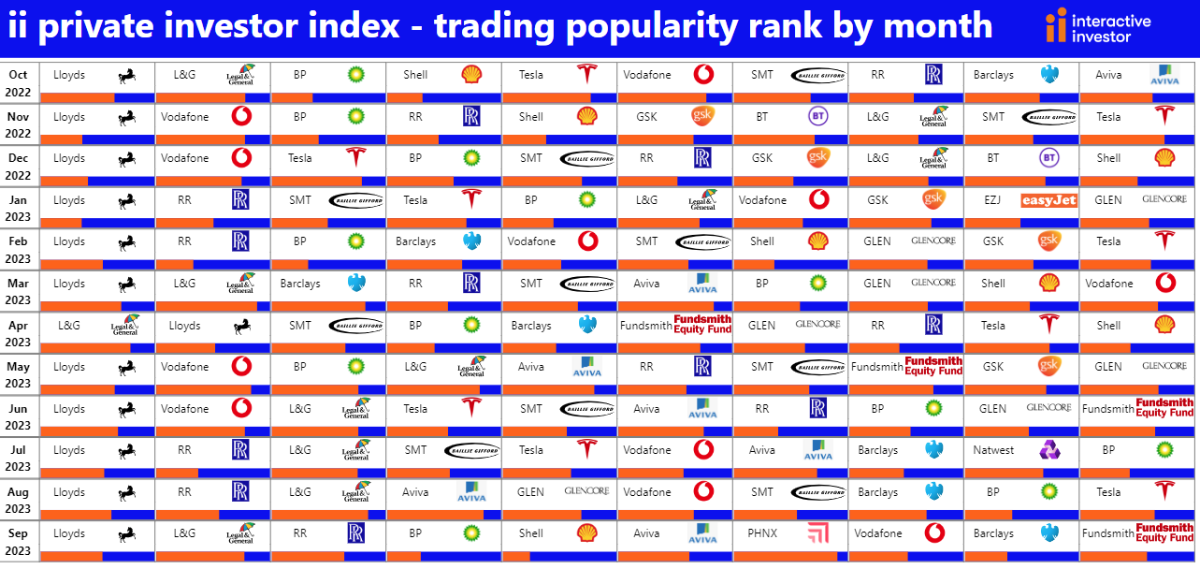
Blue: sell
Orange: buy
ii customer performances quoted are median values to avoid the influence of outlier performance skewing the data.
The performance is calculated using the Time Weighted Rate of Return with returns calculated before each money transaction, then the results compounded over the reporting period. The time-weighted rate of return (TWR) is a measure of the compound rate of growth in a portfolio. It eliminates the distorting effects on growth rates created by inflows and outflows of money.
Then median averages are calculated independently for each group we analysed – so that outlier performances did not skew the results.
Index performance, unless otherwise stated, is ii using Morningstar, total return in GBP, to end September 2023.
Portfolio values under £20,000 were stripped out to keep the sample representative of ii’s core customer base.
These articles are provided for information purposes only. Occasionally, an opinion about whether to buy or sell a specific investment may be provided by third parties. The content is not intended to be a personal recommendation to buy or sell any financial instrument or product, or to adopt any investment strategy as it is not provided based on an assessment of your investing knowledge and experience, your financial situation or your investment objectives. The value of your investments, and the income derived from them, may go down as well as up. You may not get back all the money that you invest. The investments referred to in this article may not be suitable for all investors, and if in doubt, an investor should seek advice from a qualified investment adviser.
Full performance can be found on the company or index summary page on the interactive investor website. Simply click on the company's or index name highlighted in the article.