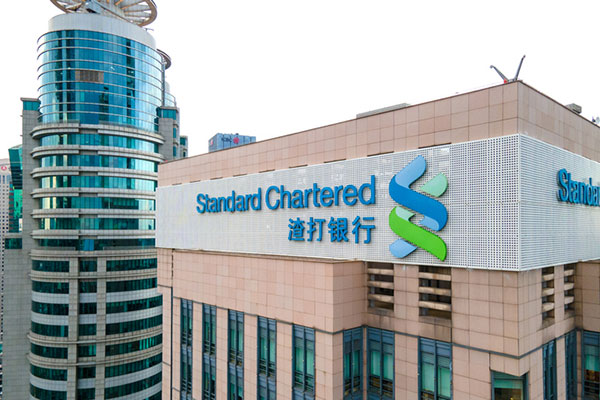
ii view: Asian play Standard Chartered in buoyant mood
The FTSE 100 bank, previously subject to a takeover approach, has announced a $1.5 billion share buyback programme. We assess prospects.
23rd August 2024 16:08
by Keith Bowman from interactive investor

First-half results 30 June
- Operating income up 11% to $10 billion
- Reported pre-tax profit up 5% to $3.5 billion
- Capital cushion, or CET1 ratio, rising to 14.6% from 13.9%
- Interim dividend up 50% to 9 US cents per share
- New $1.5 billion share buyback programme
Chief executive Bill Winters said: “We produced a strong set of results for the first half of the year, demonstrating the value of our franchise as a cross-border corporate and investment bank and a leading wealth manager for affluent clients.
“We are upgrading our guidance for income growth, which we now expect to be above 7% in 2024, and we are announcing our largest-ever share buyback of $1.5 billion. This brings our total shareholder distributions announced since full-year 2023 results to $2.7 billion.”
- Invest with ii: Top UK Shares | Share Tips & Ideas | What is a Managed ISA?
ii round-up:
Headquartered in the UK, Standard Chartered (LSE:STAN) operates across 50-plus countries, primarily in Asia, Africa, and the Middle East.
The FTSE 100 company operates across two divisions. Corporate, Commercial & Institutional Banking generates most sales at just over three-fifths, with Consumer, Private & Business Banking accounting for most of the balance.
For a round-up of these latest results announced on 30 July, please click here.
ii view:
Tracing its history back to 1853, Standard Chartered is today an international bank employing over 80,000 people. Asia accounted for its biggest chunk of sales in 2023 at 70%, followed by the Middle East and Africa at 16%, the combined Europe and Americas 9%, and other countries the balance.
For investors, exposure to China and Hong Kong is not without risk, given strained relations between the West and China with Taiwan remaining a focal point. Events in the Middle East have resulted in the bank previously closing representative offices in Jordan and Lebanon. Industry costs such as wages remain elevated, while a forecast dividend yield of around 3% contrasts with yields of over 5% at Lloyds Banking Group (LSE:LLOY), NatWest Group (LSE:NWG) and HSBC Holdings (LSE:HSBA).
- The two shares star investor Bill Ackman has snapped up
- Support builds for high-yielding insurer
- Standard Chartered shares respond well to half-year results beat
More favourably, more than four-fifths of income derive from expected geographical growth regions such as Asia and Africa. A focus on affluent clients has seen the bank’s wealth business attract $23 billion of net new money, meaning it is on track to hit its three-year target of $80 billion. Costs continue to be attacked, while an upping of the dividend and new share buyback programme cannot be overlooked.
For now, and despite continued risks, a consensus analyst estimate of fair value sat at over 900p per share is likely to keep existing shareholders at least loyal.
Positives:
- Both business type and geographical diversity
- Previous takeover approach
Negatives:
- Concerns for China’s economy
- Geopolitical tensions
The average rating of stock market analysts:
Strong hold
These articles are provided for information purposes only. Occasionally, an opinion about whether to buy or sell a specific investment may be provided by third parties. The content is not intended to be a personal recommendation to buy or sell any financial instrument or product, or to adopt any investment strategy as it is not provided based on an assessment of your investing knowledge and experience, your financial situation or your investment objectives. The value of your investments, and the income derived from them, may go down as well as up. You may not get back all the money that you invest. The investments referred to in this article may not be suitable for all investors, and if in doubt, an investor should seek advice from a qualified investment adviser.
Full performance can be found on the company or index summary page on the interactive investor website. Simply click on the company's or index name highlighted in the article.