The indicators that help us decide when to sell
27th September 2021 13:04
by Douglas Chadwick from ii contributor
Saltydog Investor is holding his nerve and sticking to his trading rules in the hope that we are through the worst of this particular storm.

This content is provided by Saltydog Investor. It is a third-party supplier and not part of interactive investor. It is provided for information only and does not constitute a personal recommendation.
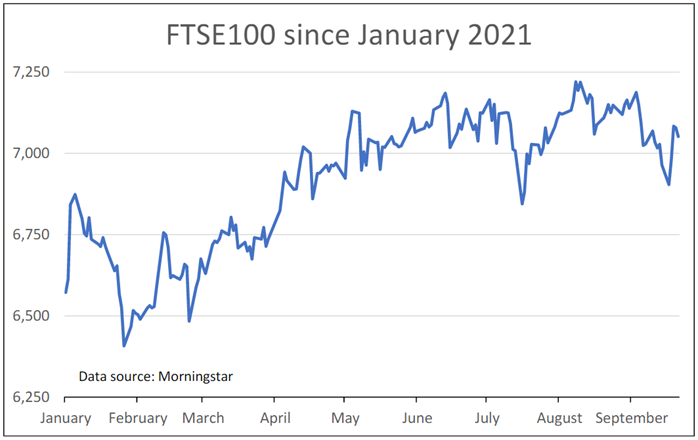
Over the last couple of weeks, we have seen the FTSE 100 fall below 7,000 as most Western Economies have dropped back from their recent highs. On 11 August it closed just above 7,220, the highest that it has been all year, but last Monday it was down at 6,904. It had lost 4.4% in less than six weeks.
Past performance is not a guide to future performance.
Each week we look at the performance of thousands of funds, and also monitor the Investment Association sectors.
Over the last fortnight, we have seen the general downturn reflected in our numbers. A few of the bond sectors have made gains, but nearly all of the sectors investing in equities have gone down.
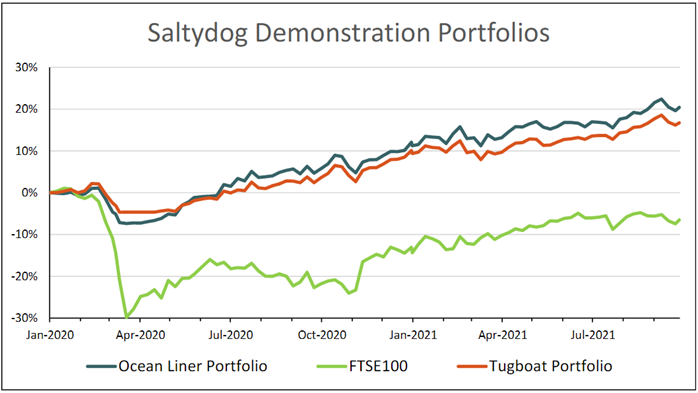
When we reviewed our demonstration portfolios last Wednesday, they were both showing losses for the second week in a row. The Tugboat had gone down by 0.6%, since the previous Wednesday, and the Ocean Liner had lost 0.7%. Most of the individual funds that we were holding were also showing one-week losses. The exceptions were Jupiter India, which was up 1.2%, and the FSSA Japan Focus fund that we only went into the week before.
- Ian Cowie: bargains for the brave and a fundraise to avoid
- Fund managers slow to cut equities despite being bearish on economy
- How Saltydog invests: a guide to its momentum approach
It is never great to see the portfolios go down, and as momentum traders we believe in selling as prices fall rather than waiting for things to hit rock bottom. However, we do not want to move too early because we know that it is not unusual for a fund to have a couple of bad weeks and then rebound.
It is difficult to find the right balance, and to a certain extent it will depend on your personal appetite for risk and how much you are willing to lose. Unlike the FTSE 100, which peaked in May 2018, both of our demonstration portfolios are pretty close to the all-time highs that they recorded a few weeks ago, and so at least we were giving ground from a relatively elevated position.
There are a couple of indicators that we use to help us decide when to sell. One is our 'three weeks in decile six or worse rule'. Every week we rank all of the funds in each of our Saltydog Groups based on their one-week return. The top 10% go into decile one, the next best 10% go into decile two, and so on until the worst 10% end up in decile ten. If a fund has three consecutive weeks when its individual one-week decile ranking is six or worse then we will either sell the fund or reduce our holding. When we looked last week, none of the funds in our portfolios were breaking this rule.
- Don’t be shy, ask ii...when should I sell and lock in profits?
- Subscribe to the ii YouTube channel and catch all our latest interviews and video content
- Take control of your retirement planning with our award-winning, low-cost Self-Invested Personal Pension (SIPP)
One of the limitations of the decile rule is that it does not take into account the absolute returns of the funds or the sectors that they are in. It is all well and good being in the top deciles, but it does not really help if everything is going down!
However, although the recent returns have not been great, all of the sectors that the funds from our portfolios are in were still showing gains over the previous four weeks (which we use as the key indicator). In the end, we decided to hold our nerve and did not make any changes. In the last few days our portfolios have rebounded a little, as stock markets have rallied.
Past performance is not a guide to future performance.
It is probably too early to tell, but it looks as though we may well be through the worst of this particular storm.
For more information about Saltydog, or to take the 2-month free trial, go to www.saltydoginvestor.com
These articles are provided for information purposes only. Occasionally, an opinion about whether to buy or sell a specific investment may be provided by third parties. The content is not intended to be a personal recommendation to buy or sell any financial instrument or product, or to adopt any investment strategy as it is not provided based on an assessment of your investing knowledge and experience, your financial situation or your investment objectives. The value of your investments, and the income derived from them, may go down as well as up. You may not get back all the money that you invest. The investments referred to in this article may not be suitable for all investors, and if in doubt, an investor should seek advice from a qualified investment adviser.
Full performance can be found on the company or index summary page on the interactive investor website. Simply click on the company's or index name highlighted in the article.