Intermediate and long-term 'sell' signals explained
31st October 2016 11:08
by Lance Roberts from ii contributor
Market trapped as recession risk rises
This week I want to discuss several risks I am currently watching starting to manifest "behind the scenes" so to speak. But first, let's take a quick review of the markets, which currently are flashing some very troubling signs.
Last week, I discussed the ongoing consolidation and struggle as the markets remain "trapped" between downtrend resistance and the crucial support levels of the previous breakout to new highs. The charts below have been updated through Friday afternoon.
(Note: as I am writing this Jason Chaffetz just confirmed the FBI was reopening the investigation into Hillary Clinton's emails based on new evidence. This has caused the market to panic a bit and the battle to hold support is being waged as I write this.)
"If we zoom in we can get a little clearer picture about the breakdown."
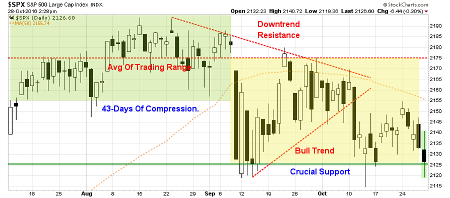
The two dashed red lines show the tightening consolidation pattern more clearly.
Importantly, while the market has remained in suspended animation over the past three months, the deterioration of the market is quite evident.
However, despite the ongoing political circus, weak corporate earnings (considering the massive reductions in expectations since the beginning of the year), and both missing expectations (which really goes to the heart of the consumer) and consumer sentiment waning, it is surprising the markets are still holding up as well as they are.
As long as the markets can maintain support about 2,125, the bull market is still in play - but, at this point, not by much.
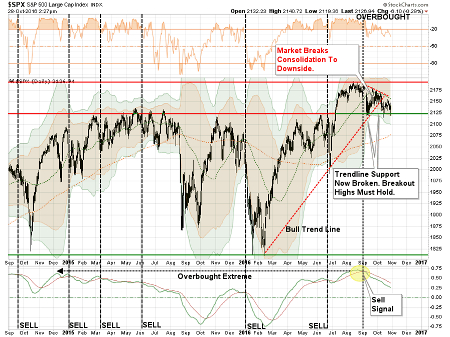
More importantly, though, despite the ongoing defence of support at current levels, the deterioration in momentum and price action has now triggered intermediate and longer-term "'sell' signals" as shown below.

Importantly, notice that both of the previous bullish trend lines (depending on how you measure them) have now been violated. Previously, when both "'sell' signals" have been triggered, particularly with the market overbought as it is now, the subsequent decline has been rather sharp.

Lastly, as stated above, the 50-day moving average has begun to trend lower, the downtrend resistance from the previous market highs remains present and the "'sell' signal" occurring at high levels suggests the risk of a further correction has not currently been eliminated.
As stated last week, and remains this week:
"It is important, as an investor, is not to 'panic' and make emotionally-driven decisions in the short-term. All that has happened currently is a 'warning' you should start paying attention to your investments."
Just be cautious for the moment.
This article is for information and discussion purposes only and does not form a recommendation to invest or otherwise. The value of an investment may fall. The investments referred to in this article may not be suitable for all investors, and if in doubt, an investor should seek advice from a qualified investment adviser.
Lance Roberts is a Chief Portfolio Strategist/Economist for Clarity Financial. He is also the host of "The Lance Roberts Show" and Chief Editor of the "Real Investment Advice" website and author of The "Real Investment Daily" blog and the "Real Investment Report". Follow Lance on Facebook, Twitter and Linked-In.