Kepler Trust report: Scottish Mortgage Investment Trust
Scottish Mortgage runs a concentrated portfolio targeting significant growth opportunities globally.
3rd October 2019 16:53
This content is provided by Kepler Trust Intelligence, an investment trust focused website for private and professional investors. Kepler Trust Intelligence is a third-party supplier and not part of interactive investor. It is provided for information only and does not constitute a personal recommendation.
Material produced by Kepler Trust Intelligence should be considered a marketing communication, and is not independent research.
Targeting significant growth opportunities across the world, SMT runs a concentrated portfolio of listed and unlisted equities.

Callum Stokeld, investment trust research analyst at Kepler Trust Intelligence.
Summary
Scottish Mortgage (LSE:SMT) is a global equity portfolio run with a long-term investment time-frame, via a highly-concentrated, growth-orientated stock picking approach. It is the largest ‘conventional’ UK-listed investment trust with net assets of over £8.3 billion. The managers aim to invest in the most promising growth companies across the globe, whether publicly listed or private.
SMT, which is a member of the FTSE 100, has built a long-term track record of outperformance, growing assets at a rate far in excess of its benchmark index and its sector over the past 20 years. The managers’ focus on exponential structural growth opportunities, seeking to identify companies with products that can change and dominate consumers’ spending habits, often leads them to take sizeable long-term positions in often highly volatile stocks, and the portfolio has often been characterised by a strong weighting to technology stocks.
In recent years the managers have identified that an increasing number of companies are seeking to remain privately listed for longer, or even to avoid a public listing altogether. Noting that this often affords management greater freedom to pursue long-term growth opportunities, in alignment with its own investment style, it has sought to incorporate exposure to the private equity market in SMT, and presently holds around 22% (as of 31/08/2019) of its portfolio in unlisted stocks (with a maximum permissible level of 25%).
The reasonably concentrated portfolio, high conviction positions and long-term outlook can often lead to periods of sharp volatility, and the trust has generally been more volatile and exposed to drawdowns than the wider market. James Anderson and Tom Slater, the managers of SMT, believe that the effects of strong management and company growth in their stocks cannot be expected to be realised in less than five years, and tend to look through such short-term volatility.
Scottish Mortgage remains a strongly performing higher-risk option for equity investors, yet is among the cheapest in terms of OCF. The trust has generated higher levels of volatility than the index and peers and is currently on a discount of 2.3%.
Portfolio
Managed by James Anderson and Tom Slater, Scottish Mortgage places an emphasis on a long-term approach to investment, targeting companies across the globe that have the ability to grow exponentially. Seeking to identify, at an early stage, companies taking a long-term approach, they have a preference for products that address potentially huge markets. The managers view shareholdings as owning companies, as opposed to ‘renting’ a share in them, focusing on the best sustainable growth opportunities.
The managers are explicitly focused on growth, characterising their investment process as ‘growth at an unreasonable price’, emphasising that the kind of exponential compounding growth opportunities they seek to invest in will generally require paying a very high multiple on the stock. This offers to them the possibility that present earnings, sales etc. are not yet reflective of the company’s potential.
With a blue-sky approach to potential returns, the managers are far more focused on recognising the potential drivers of success and growth than on mitigating against potential downside. They believe that equity markets structurally offer asymmetry in their payoff structure, with theoretically unlimited upside and downside limited to 100%. Coupled with their long-term outlook, the managers are accordingly willing to accept near-term share price volatility; SMT’s returns have been consistently more volatile than the benchmark but, as can be seen in the ‘Performance’ section, there has been commensurate outperformance to compensate long-term holders.
Portfolio construction is built from the bottom-up, with position sizing largely a function of stock conviction. James and Tom look to assess management strength, with a preference for founders or family members to be involved in the management and to remain significant owners of stock. The long-term track record, reputation as a long-term holder of stock and very large scale at which they invest (given the very large asset base) often affords them significant access to management.
A company’s product offerings and prospects for sales and margin growth are also considered key, with the managers keen on companies with market-leading products favoured by customers and with exponential growth potential.
Whilst top-down macroeconomic considerations are not considered valuable to portfolio construction, the managers are interested in ongoing events and thematic developments in the direction and nature of future growth. Also, they are fairly agnostic as to market cycles, and interested in structural trends.
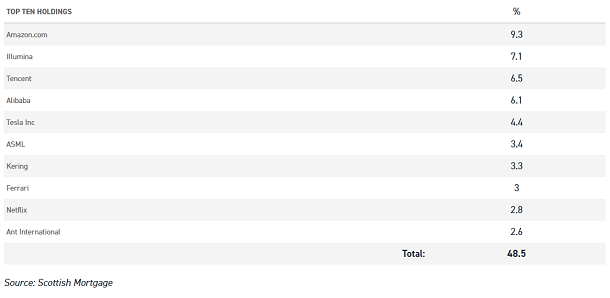
Whilst SMT is nominally benchmarked against the FTSE All-World, the managers pay no attention to the benchmark index in portfolio construction, using it solely for comparative performance purposes. As a result, they have a highly differentiated portfolio with an active share of c. 94%. A tendency to run their winners reinforces the long-term investment approach, and the managers take conviction positions in their preferred stocks, with c. 48.5% in the top ten holdings (as of 31 August 2019).
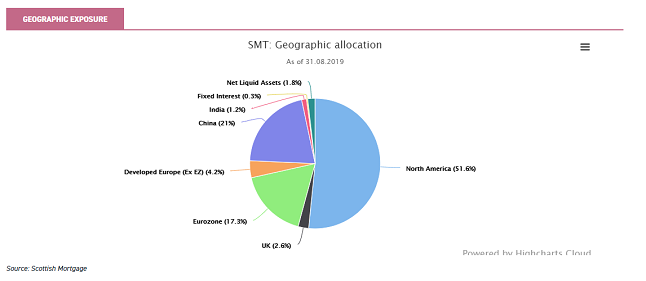
As a global, ‘go-anywhere’ fund, SMT is unconstrained in its regional allocation. With the US having the world’s largest stockmarket and leading technology sector, it is unsurprising that exposure in this region is very significant, whilst the high weighting to China is representative of the high growth potential they have identified in select companies in that country.
Noting that, increasingly, companies are choosing to delay listing on public markets until they are more mature, the managers have started to incorporate increasingly large numbers of unlisted companies to their portfolio. They have done so in order to continue to access what they believe to be the most promising growth opportunities available, noting that restricting their portfolio to listed companies is likely, in the future, to miss out the period of most rapid growth in many companies.
In this, SMT is in many respects likely to continue to move increasingly towards a private equity approach in practice, having incorporated many similar analytical processes in its public market investments, though unlisted holdings will remain capped at 25% (presently 22%).
In this position, it will be providing equity financing for young companies with innovative or disruptive business models; it should be noted that it has previously been willing to do so for listed companies as well, allowing its equity to be diluted to help sustain what it sees as the long-term growth opportunity – for example, when it provided more capital to Tesla earlier in 2019.
Many of these positions are expected to eventually list on the market, and will likely be increased further at this stage; this was the case, for example, with the holding in Lyft (NASDAQ:LYFT) after it listed in March 2019. SMT’s relationship with management in listed companies has been cited as a factor that helps it to access certain unlisted opportunities, such as Ant Financial and SpaceX.
The managers note that increasingly companies are opting to remain private for longer, or, in some instances, forever. This often allows alignment with the SMT investment process, as private equity status affords greater freedom for business managers to invest for the long term without worrying about meeting short-term targets, with some studies showing significantly superior productivity performance from private companies to their public peers.
For investors, this can be a source of opportunity, opacity and risk. Opportunity has been clearly highlighted by the successful IPO launches of recent years and the track record thus far demonstrated in the private equity sleeve since 2010. In November 2018 the managers of SMT reported that this portion of the trust has generated a return of 419% since 2010, and returns at the time from SMT overall of 344%.
Clearly, however, this can make portfolio assessment more challenging for shareholders, with less recourse to assess the merits of numerous unquoted holdings; challenges from investors on the overall level of unlisted holdings and the composition may become increasingly important for SMT in this regard going forward.
The board has also made it clear that it will monitor and consider the unlisted holdings in the context of the overall investment strategy on an ongoing basis.
Furthermore, there is clearly additional risk, with periodic valuations possibly misaligned with wider market sentiment. Whilst SMT did not hold either, for example, the recent failed IPO of WeWork and issues around the Peloton IPO highlighted the potential divergence between private equity and public market valuations of certain companies.
However, SMT has taken steps to mitigate any disconnect between the private market valuation and that of the public market, and all unlisted holdings’ valuations are subject to scrutiny by the audit committee.
With a US presidential election looming in 2020, there has been significant discussion around interpretations of anti-trust legislation, particularly in relation to the US technology giants, though the general relationship of competition law and market share is being re-examined.
Several presidential candidates with realistic chances of being elected, and numerous other politicians from both sides of the political spectrum, have mooted possible enforced break-ups of certain technology giants; with its focus on younger companies with strong growth potential, a significant portion of SMT may not be directly affected by such concerns, but major holdings such as Amazon (NASDAQ:AMZN), Alphabet (NASDAQ:GOOGL) and Facebook (NASDAQ:FB) likely would be. We discussed in more detail the potential impact of regulation on investment returns in a strategy article earlier this year.
Gearing
The company has been locking in low interest rates by issuing long-term, fixed-rate private placement notes. Gearing had progressively decreased as the trust’s size increased and markets continued to rally. In June 2018, reflecting the board’s view that the gearing level was below the optimum level, the board secured a further £170m of 20-to-30-year borrowing at a cost of just under 3%, worth roughly 2% at current NAV levels. Gearing is currently at 6%, and the board has committed to reviewing it on an ongoing basis to ensure it is at an appropriate level.
Performance
Long-term performance has been extremely strong, with NAV and share price total returns over the past ten years strongly outstripping that of the sector and benchmark FTSE All World. NAV total returns over the ten-year period to 25/09/2019 were 423% (share price total returns were c. 465%), against Morningstar sector NAV returns of c. 201% and benchmark returns of c. 205%.
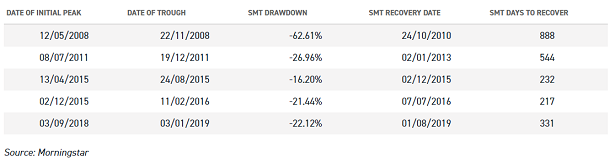
The managers’ long-term investment approach and willingness to accept near-term share price volatility can lead to sustained drawdowns, which in turn can result in lengthy recovery times. Five periods where SMT experienced sizeable or sharp drawdowns, and the recovery times until it regained its previous peak, can be seen below.
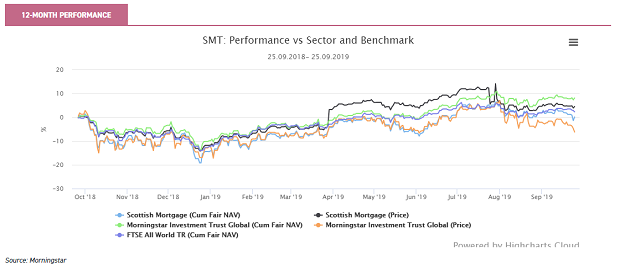
Recent returns have proven more challenging, with NAV returns lagging the benchmark and sector, though share price returns have been more resilient with investor demand remaining strong.
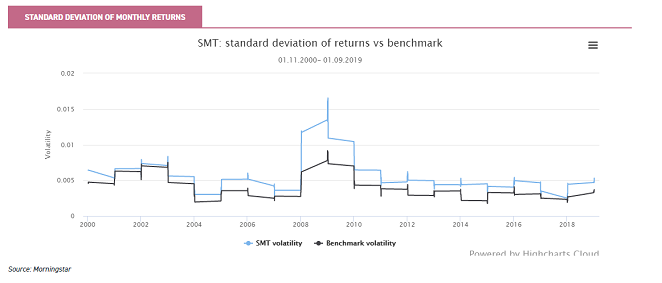
As noted in the ‘Portfolio’ section, the investment process tends to result in heightened volatility compared to the wider market, and this can be seen in the chart below. This shows the standard deviation of monthly returns over a rolling 12-month period for SMT (blue line) and the benchmark index (FTSE All World – black line) over the past 20 years. SMT’s volatility has consistently been greater than that of the benchmark index over this period. (Please note that the scale used on the y-axis is an indexed level and not a measure of absolute volatility.)
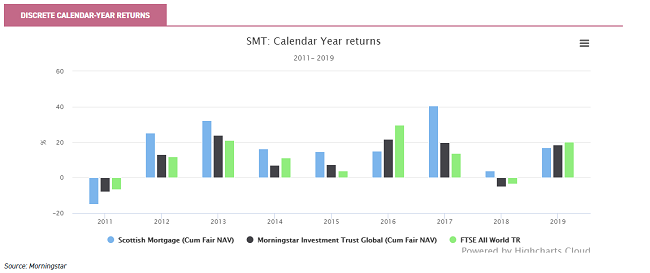
Returns on a discrete basis have been strong in recent years, emphasising the positive environment for this investment strategy. Underperformance in 2016 was unsurprising in this regard, as this year saw a significant outperformance of value investment strategies, and a broad-based rally in cyclical areas of the market.
Dividend
SMT targets total return, but the focus of the portfolio is very much on adopting a ‘growth’ investment approach. Dividends are not a consideration of the managers’ investment process; indeed, if anything, they are likely to regard a regular and growing distribution as a negative indicator that a company is nearing full maturity.
However, there is a small dividend paid, amounting to a c. 0.6% yield at present. The board aims to grow this over time, and the company has increased its dividends for 36 consecutive years.
Management
James Anderson has been the manager of Scottish Mortgage since 2000, and he has been a senior figure at Baillie Gifford for a considerably longer period. Tom Slater was appointed deputy manager in 2009 and became joint co-manager in 2015. They take a five- to ten-year view of investments and do their best to insulate themselves from what they view as ‘noise’, preferring to look past short-term earnings and take a view on prospects further down the line than many other managers.
Baillie Gifford is one of the UK’s largest and most successful private investment management partnerships with great stability and depth of resources. James and Tom are able to draw on the expertise of around 100 investors across the firm, and often take unorthodox research avenues.
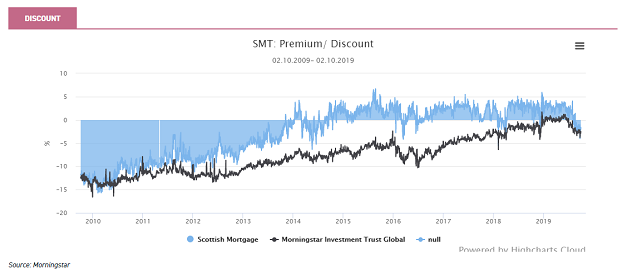
Discount
SMT presently sits on a discount of c. -2.3%. This compares to a median premium of 2.2% over the past five years; however, prior to 2014 it was common for the trust to trade at a discount.
Strong historic performance, allied to SMT’s promotion to the FTSE 100, means it is unsurprising that SMT has frequently traded at a premium to NAV for much of the past five years. Membership of the FTSE 100 means shares are highly liquid. However, rotational activity in stockmarkets has been to the recent detriment of SMT, and shares have moved out to a small discount. The recent move to a discount has not been a result of share prices failing to rise in line with NAV, with NAV falling slightly in recent weeks. The recent failed IPO of WeWork, and difficulties surrounding the IPO of Peloton, have probably contributed to the recent move; whilst SMT did and does not hold either, the events may indicate a growing scepticism about the valuation of pre-profitable companies.
The board has no formal discount control mechanism, but it has a stated intent to “aid the efficient functioning of the market” in its shares – issuing and buying shares back in “normal market conditions”.
Charges
Since entering the FTSE 100, SMT has changed its charging structure. The existing 0.3% management fee will be charged up to the first £4 billion of assets, after which the fee falls to 0.25%. The OCF is presently 0.37%, compared to a sector average OCF of 0.56%. The Key Information Document reduction in yield (RIY) figure is 0.8%, compared to a sector average of 1%, although we caution that methodologies vary.
Kepler Partners is a third-party supplier and not part of interactive investor. Neither Kepler Partners or interactive investor will be responsible for any losses that may be incurred as a result of a trading idea.
Full performance can be found on the company or index summary page on the interactive investor website. Simply click on the company's or index name highlighted in the article.
Important Information
Kepler Partners is not authorised to make recommendations to Retail Clients. This report is based on factual information only, and is solely for information purposes only and any views contained in it must not be construed as investment or tax advice or a recommendation to buy, sell or take any action in relation to any investment.
This report has been issued by Kepler Partners LLP solely for information purposes only and the views contained in it must not be construed as investment or tax advice or a recommendation to buy, sell or take any action in relation to any investment. If you are unclear about any of the information on this website or its suitability for you, please contact your financial or tax adviser, or an independent financial or tax adviser before making any investment or financial decisions.
The information provided on this website is not intended for distribution to, or use by, any person or entity in any jurisdiction or country where such distribution or use would be contrary to law or regulation or which would subject Kepler Partners LLP to any registration requirement within such jurisdiction or country. Persons who access this information are required to inform themselves and to comply with any such restrictions. In particular, this website is exclusively for non-US Persons. The information in this website is not for distribution to and does not constitute an offer to sell or the solicitation of any offer to buy any securities in the United States of America to or for the benefit of US Persons.
This is a marketing document, should be considered non-independent research and is subject to the rules in COBS 12.3 relating to such research. It has not been prepared in accordance with legal requirements designed to promote the independence of investment research.
No representation or warranty, express or implied, is given by any person as to the accuracy or completeness of the information and no responsibility or liability is accepted for the accuracy or sufficiency of any of the information, for any errors, omissions or misstatements, negligent or otherwise. Any views and opinions, whilst given in good faith, are subject to change without notice.
This is not an official confirmation of terms and is not to be taken as advice to take any action in relation to any investment mentioned herein. Any prices or quotations contained herein are indicative only.
Kepler Partners LLP (including its partners, employees and representatives) or a connected person may have positions in or options on the securities detailed in this report, and may buy, sell or offer to purchase or sell such securities from time to time, but will at all times be subject to restrictions imposed by the firm's internal rules. A copy of the firm's conflict of interest policy is available on request.
Past performance is not necessarily a guide to the future. The value of investments can fall as well as rise and you may get back less than you invested when you decide to sell your investments. It is strongly recommended that Independent financial advice should be taken before entering into any financial transaction.
PLEASE SEE ALSO OUR TERMS AND CONDITIONS
Kepler Partners LLP is a limited liability partnership registered in England and Wales at 9/10 Savile Row, London W1S 3PF with registered number OC334771.
Kepler Partners LLP is authorised and regulated by the Financial Conduct Authority.
Kepler Partners is a third-party supplier and not part of interactive investor. Neither Kepler Partners or interactive investor will be responsible for any losses that may be incurred as a result of a trading idea.
These articles are provided for information purposes only. Occasionally, an opinion about whether to buy or sell a specific investment may be provided by third parties. The content is not intended to be a personal recommendation to buy or sell any financial instrument or product, or to adopt any investment strategy as it is not provided based on an assessment of your investing knowledge and experience, your financial situation or your investment objectives. The value of your investments, and the income derived from them, may go down as well as up. You may not get back all the money that you invest. The investments referred to in this article may not be suitable for all investors, and if in doubt, an investor should seek advice from a qualified investment adviser.
Full performance can be found on the company or index summary page on the interactive investor website. Simply click on the company's or index name highlighted in the article.
Important Information
Kepler Partners is not authorised to make recommendations to Retail Clients. This report is based on factual information only, and is solely for information purposes only and any views contained in it must not be construed as investment or tax advice or a recommendation to buy, sell or take any action in relation to any investment.
This report has been issued by Kepler Partners LLP solely for information purposes only and the views contained in it must not be construed as investment or tax advice or a recommendation to buy, sell or take any action in relation to any investment. If you are unclear about any of the information on this website or its suitability for you, please contact your financial or tax adviser, or an independent financial or tax adviser before making any investment or financial decisions.
The information provided on this website is not intended for distribution to, or use by, any person or entity in any jurisdiction or country where such distribution or use would be contrary to law or regulation or which would subject Kepler Partners LLP to any registration requirement within such jurisdiction or country. Persons who access this information are required to inform themselves and to comply with any such restrictions. In particular, this website is exclusively for non-US Persons. The information in this website is not for distribution to and does not constitute an offer to sell or the solicitation of any offer to buy any securities in the United States of America to or for the benefit of US Persons.
This is a marketing document, should be considered non-independent research and is subject to the rules in COBS 12.3 relating to such research. It has not been prepared in accordance with legal requirements designed to promote the independence of investment research.
No representation or warranty, express or implied, is given by any person as to the accuracy or completeness of the information and no responsibility or liability is accepted for the accuracy or sufficiency of any of the information, for any errors, omissions or misstatements, negligent or otherwise. Any views and opinions, whilst given in good faith, are subject to change without notice.
This is not an official confirmation of terms and is not to be taken as advice to take any action in relation to any investment mentioned herein. Any prices or quotations contained herein are indicative only.
Kepler Partners LLP (including its partners, employees and representatives) or a connected person may have positions in or options on the securities detailed in this report, and may buy, sell or offer to purchase or sell such securities from time to time, but will at all times be subject to restrictions imposed by the firm's internal rules. A copy of the firm's conflict of interest policy is available on request.
Past performance is not necessarily a guide to the future. The value of investments can fall as well as rise and you may get back less than you invested when you decide to sell your investments. It is strongly recommended that Independent financial advice should be taken before entering into any financial transaction.
PLEASE SEE ALSO OUR TERMS AND CONDITIONS
Kepler Partners LLP is a limited liability partnership registered in England and Wales at 9/10 Savile Row, London W1S 3PF with registered number OC334771.
Kepler Partners LLP is authorised and regulated by the Financial Conduct Authority.
These articles are provided for information purposes only. Occasionally, an opinion about whether to buy or sell a specific investment may be provided by third parties. The content is not intended to be a personal recommendation to buy or sell any financial instrument or product, or to adopt any investment strategy as it is not provided based on an assessment of your investing knowledge and experience, your financial situation or your investment objectives. The value of your investments, and the income derived from them, may go down as well as up. You may not get back all the money that you invest. The investments referred to in this article may not be suitable for all investors, and if in doubt, an investor should seek advice from a qualified investment adviser.
Full performance can be found on the company or index summary page on the interactive investor website. Simply click on the company's or index name highlighted in the article.