Lloyds Bank's share chart reveals hope for the future
After extending their recent peak to within sight of 80p, shares in the lender have paused for breath. Independent analyst Alistair Strang explains what his charts tell us about their potential.
29th May 2025 07:59
by Alistair Strang from Trends and Targets
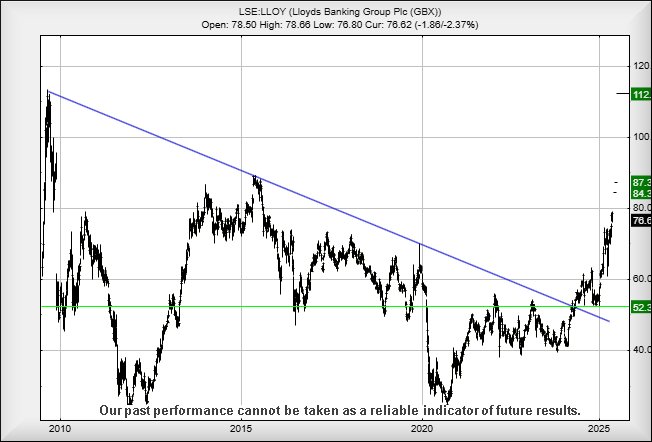
The holiday Monday ensured we neatly skipped over the puddle which is our weekly look at one of the UK’s retail banks. This weeks victim, Lloyds Banking Group (LSE:LLOY), almost provoked us to skip comment, then we noticed their share price had achieved our critical 77p level, even stalling at such a level for the most recent seven sessions which tends to suggest we’ve been (thankfully) following the correct trend! Importantly, despite the stall, on repeated occasions the price has closed at 78p, enacting our favourite miracle of closing above a price target level.
- Invest with ii:Open a Stocks & Shares ISA | Top ISA Funds | Transfer your ISA to ii
To dwell on the grim news first, it’s now the case Lloyds Bank's share price needs to close below 52p to justify outright panic, this being a movement which would utterly trash our optimistic predictions. Without joking, this number is now a really big deal and worth remembering, just in case everything goes pear-shaped and the price drops.
However, share movements this year impart some optimism, a mood shared among the big three retail banks, almost regardless of the ignored detail the USA has effectively declared economic war on the rest of the world. Then again, perhaps this is the reason the banks are starting to flourish, working on the basis that banks tend to enjoy international chaos.
Watching sterling perform well against the dollar is certainly giving an inkling as to what is going on in the economic world, a weaker dollar making the entire country more attractive from many aspects.
From our immediate perspective, above 78.1p should prove useful for Lloyds, ideally triggering a small surge to an initial 84p with our longer-term secondary, if beaten, at a close by 87p. The proximity of these target levels tends to suggest a risk of market hesitation, a price level at which share prices will inevitably bounce around. But importantly, the price is now trading in a zone where a future 112p has become a major item of interest, a price level at which we certainly anticipate some hesitation.
For now, we’re weirdly hopeful for the future of the retail banks.
Source: Trends and Targets. Past performance is not a guide to future performance.
Alistair Strang has led high-profile and "top secret" software projects since the late 1970s and won the original John Logie Baird Award for inventors and innovators. After the financial crash, he wanted to know "how it worked" with a view to mimicking existing trading formulas and predicting what was coming next. His results speak for themselves as he continually refines the methodology.
Alistair Strang is a freelance contributor and not a direct employee of Interactive Investor. All correspondence is with Alistair Strang, who for these purposes is deemed a third-party supplier. Buying, selling and investing in shares is not without risk. Market and company movement will affect your performance and you may get back less than you invest. Neither Alistair Strang or Interactive Investor will be responsible for any losses that may be incurred as a result of following a trading idea.
These articles are provided for information purposes only. Occasionally, an opinion about whether to buy or sell a specific investment may be provided by third parties. The content is not intended to be a personal recommendation to buy or sell any financial instrument or product, or to adopt any investment strategy as it is not provided based on an assessment of your investing knowledge and experience, your financial situation or your investment objectives. The value of your investments, and the income derived from them, may go down as well as up. You may not get back all the money that you invest. The investments referred to in this article may not be suitable for all investors, and if in doubt, an investor should seek advice from a qualified investment adviser.
Full performance can be found on the company or index summary page on the interactive investor website. Simply click on the company's or index name highlighted in the article.