NatWest Group shares could hit a glass ceiling here
The retail banks continue to show recovery signs. Our chartist sees where things could be heading.
12th October 2020 10:08
by Alistair Strang from Trends and Targets
The retail banks continue to show recovery signs. Our chartist sees where things could be heading.
NatWest Group (LSE:NWG)
The retail banks, or as we call them, the clown sector of the FTSE 100, continue to show signs of recovering from the limbo dance of share prices.
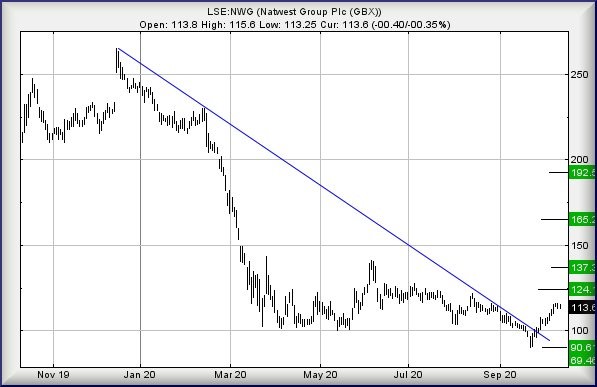
NatWest managed to achieve our previous suggestion of 90p, taking the price below that achieved when the banking sector collapsed in 2009.
Actually, the price bounced slightly above our 90p target, thus allowing some hope for the future.
Presently trading around the 113p level, the share needs next trade above 116.5p to confirm our fledgling optimism as this is supposed to trigger continued recovery to an initial 124p with secondary, if exceeded, a marginally more respectable 137p.
Visually, there's every chance the 137p level shall provoke some hesitation if achieved.
This price level matches the immediate high following the March Covid drop and again, matches the high of last June.
Experience tends to teach us to watch out for glass ceiling levels and this one certainly appears a willing contender.
Only with closure above 137p dare we believe things shall become really interesting as it becomes easy to postulate continued longer-term oomph in the direction of 192p.
If it all intends to go wrong, the share needs to drip below the 100p level as reversal to 90p is expected, hopefully with another bounce.
There's a serious problem below 90p as bottom, if this level breaks, now calculates down at 69p.
Source: Trends and Targets Past performance is not a guide to future performance
Alistair Strang has led high-profile and "top secret" software projects since the late 1970s and won the original John Logie Baird Award for inventors and innovators. After the financial crash, he wanted to know "how it worked" with a view to mimicking existing trading formulas and predicting what was coming next. His results speak for themselves as he continually refines the methodology.
Alistair Strang is a freelance contributor and not a direct employee of Interactive Investor. All correspondence is with Alistair Strang, who for these purposes is deemed a third-party supplier. Buying, selling and investing in shares is not without risk. Market and company movement will affect your performance and you may get back less than you invest. Neither Alistair Strang or Interactive Investor will be responsible for any losses that may be incurred as a result of following a trading idea.
These articles are provided for information purposes only. Occasionally, an opinion about whether to buy or sell a specific investment may be provided by third parties. The content is not intended to be a personal recommendation to buy or sell any financial instrument or product, or to adopt any investment strategy as it is not provided based on an assessment of your investing knowledge and experience, your financial situation or your investment objectives. The value of your investments, and the income derived from them, may go down as well as up. You may not get back all the money that you invest. The investments referred to in this article may not be suitable for all investors, and if in doubt, an investor should seek advice from a qualified investment adviser.
Full performance can be found on the company or index summary page on the interactive investor website. Simply click on the company's or index name highlighted in the article.